Download
1 / 37
420 likes | 520 Views
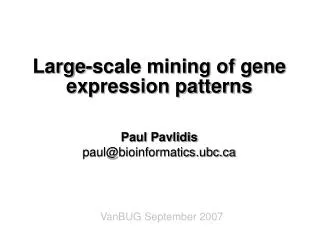
Searching for Periodic Gene Expression Patterns Using Lomb-Scargle Periodograms. http://research.stowers-institute.org/efg/2004/CAMDA Critical Assessment of Microarray Data Analysis Conference November 11, 2004. Searching for Periodic Gene Expression Patterns Using Lomb-Scargle Periodograms.

E N D
Searching forPeriodic Gene Expression Patterns Using Lomb-Scargle Periodograms http://research.stowers-institute.org/efg/2004/CAMDA Critical Assessment of Microarray Data Analysis ConferenceNovember 11, 2004
Searching for Periodic Gene Expression Patterns Using Lomb-Scargle Periodograms • Periodic Patterns in Biology • Introduction to Lomb-Scargle Periodogram • Data Pipeline • Application to Bozdech’s Plasmodium dataset • Conclusions
Periodic Patterns in Biology A vertebrate’s body plan: a segmented pattern.Segmentation is established during somitogenesis. Photograph taken at Reptile Gardens, Rapid City, SDwww.reptile-gardens.com
Periodic Patterns in Biology Intraerythrocytic Developmental Cycle of Plasmodium falciparum From Bozdech, et al, Fig. 1A, PLoS Biology, Vol 1, No 1, Oct 2003, p 3. RNA from parasitized red blood cells Cy5 Expression Ratio = = RNA from all development cycles Cy3 Values for Log2(Expression Ratio) are approximately normally distributed. Assume gene expression reflects observed biological periodicity.
1 1 frequency = f = period T Simple Periodic Gene Expression Model “On” “On” “On” period(T) period(T) Expression “Off” “Off” = angular frequency = 2f Time Gene Expression = Constant Cosine(2f t)“Periodic” if only observed over a single cycle?
Introduction to Lomb-Scargle Periodogram • What is a Periodogram? • Why Lomb-Scargle Instead of Fourier? • Example Using Cosine Expression Model • Mathematical Details • Mathematical Experiments - Single Dominant Frequency - Multiple Frequencies - Mixtures: Signal and Noise
What is a Periodogram? • A graph showing frequency “power” for a spectrum of frequencies • “Peak” in periodogram indicates a frequency with significant periodicity Periodic Signal Periodogram Computation Spectral“Power” Log2(Expression) Frequency Time
Why Lomb-Scargle Instead of Fourier? • Missing data handled naturally • No data imputation needed • Any number of points can be used • No need for 2N data points like with FFT • Lomb-Scargle periodogram has known statistical properties Note: The Lomb-Scargle algorithm is NOT equivalent to the conventional periodogram analysis based Fourier analysis.
1 T = f Lomb-Scargle PeriodogramExample Using Cosine Expression Model A small value for the false-alarm probability indicates a highly significant periodic signal. Evenly-spaced time points
Lomb-Scargle PeriodogramExample Using Noisy Cosine Expression Model Unevenly-spaced time points
Lomb-Scargle Periodogram Mathematical Details PN() has an exponential probability distribution with unit mean. Source: Numerical Recipes in C (2nd Ed), p. 577
Mathematical Experiment: Single Dominant Frequency Expression = Cosine(2t/24) Single “peak” in periodogram. Single “valley” in significance curve.
Mathematical Experiment: Multiple Frequencies Expression = Cosine(2t/48) + Cosine(2t/24) + Cosine(2t/ 8) Multiple peaks in periodogram. Corresponding valleys in significance curve.
Mathematical Experiment: Multiple Frequencies Expression = 3*Cosine(2t/48) + Cosine(2t/24) + Cosine(2t/ 8) “Weaker” periodicities cannot always be resolved statistically.
Mathematical Experiment: Multiple Frequencies: “Duty Cycle” 50% 66.6% (e.g., human sleep cycle) One peak with symmetric “duty cycle”. Multiple peaks with asymmetric cycle.
Mathematical Experiment: Mixtures: Periodic Signal Vs. Noise “p” histogram 50% periodic50% noise 100% noise 100% periodic genes
Mathematical Experiment: Mixtures: Periodic Signal Vs. Noise Multiple-Hypothesis Testing More False Negatives BonferroniHolmHochbergBenjamini &Hochberg FDRNone More False Positives 50% periodic, 50% noise
Data Pipeline to Apply to Bozdech’s Data • Apply quality control checks to data • Apply Lomb-Scargle algorithm to all expression profiles • Apply multiple hypothesis testing to define “significant” genes • Analyze biological significance of significant genes
Bozdech’s Plasmodium dataset:1. Apply Quality Control Checks Global views of experiment.Remove certain outliers.
Bozdech’s Plasmodium dataset:1. Apply Quality Control Checks Many missing data points require imputation for Fourier analysis.
Bozdech’s Plasmodium dataset:2. Apply Lomb-Scargle Algorithm A weak diurnal period is visible in “mean” data profile.
Bozdech’s Plasmodium dataset:2. Apply Lomb-Scargle Algorithm Periodic Expression Patterns Examples of highly-significant periodic expression profiles.
Bozdech’s Plasmodium dataset:2. Apply Lomb-Scargle Algorithm Aperiodic/Noise Expression Patterns
Bozdech’s Plasmodium dataset:2. Apply Lomb-Scargle Algorithm Small “N” N=39 N=32
Bozdech’s Plasmodium dataset:2. Apply Lomb-Scargle Algorithm Signal and Noise Mixture
Bozdech’s Plasmodium dataset:3. Apply Multiple-Hypothesis Testing More False Negatives BonferroniHolmHochbergBenjamini &Hochberg FDRNone Significance = 1E-4 More False Positives
Bozdech’s Plasmodium dataset:3. Apply Multiple-Hypothesis Testing A priori plan: Use Benjamini & Hochberg FDR level of 0.0001. Observed number of periodic probes consistent with biological observation of ~60% of Plasmodium genome being transcriptionally active during the intraerythrocytic developmental cycle.
Bozdech’s Plasmodium dataset:4. Analyze Biological Significance Lomb-Scargle: 4358 Probes, = 1E-4 significanceComparison with Bozdech’s Results While Lomb-Scargle identified 243 new low “N” periodic probes, thelow percentage in that group may indicate some other problem.
Bozdech’s Plasmodium dataset:4. Analyze Biological Significance Lomb-Scargle: 4358 Probes, = 1E-4 significanceComparison with Bozdech’s Results Unclear how to apply Bozdech’s ad hoc “Overview” criteria for use with Lomb-Scargle method: “70% power in max frequency with top 75% of max frequency magnitude.” The best 3711 Lomb-Scargle “p” values contained 3449 (92.9%) of the Overview probes.
Bozdech’s Plasmodium dataset:4. Analyze Biological Significance “Phaseograms” Probes Ordered by Phase Probes Ordered by Phase Time Time Lomb-Scargle Results 4358 Probes Bozdech: “Overview” Dataset 2714 genes, 3395 probes
Bozdech’s Plasmodium dataset:4. Analyze Biological Significance Lomb-Scargle: 4358 Probes, = 1E-4 significance Periodogram Map • Shows periodograms, not expression profiles • Shows frequency space, not time • Dominant frequency band corresponds to 48-hr period • Are “weak” bands indicative of complex expression, perhaps a diurnal component, or an asymmetric “duty cycle”? Probes Ordered by Peak Frequency Frequency Period
Conclusions • Lomb-Scargle periodogram is effective tool to identify periodic gene expression profiles • Results comparable with Fourier analysis • Lomb-Scargle can help when data are missing or not evenly spaced We wanted to validate the Lomb-Scargle method before applying to our somitogenesis problem, since the Fourier technique would be difficult to use. Scargle (1982): “surprising result is that the … spectrum of a process can be estimated … [with] only the order of the samples ...”
Conclusions • Conclusions should not be drawn using the individual p-value calculated for each profile. A multiple comparison procedure False Discovery Rate (FDR) must be used to control the error rate. • Expression profiles may be more complex than simple cosine curves • Power spectra of non-sinusoid rhythms are more difficult to interpret
Supplementary Information http://research.stowers-institute.org/efg/2004/CAMDA
Acknowledgements Stowers Institute for Medical ResearchPourquie Lab Olivier Pourquie Mary-Lee Dequeant