Download
1 / 17
170 likes | 177 Views
Learn about conditions, t-critical values, and matched pair analysis in statistics. Includes an example and calculator instructions.

E N D
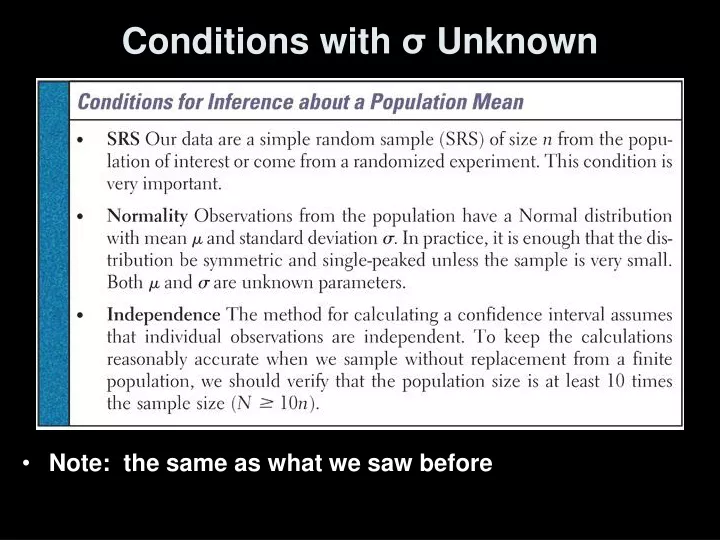
Conditions with σ Unknown • Note: the same as what we saw before
T-Distribution & Degrees of Freedom • Note: as the degrees of freedom increases (n -1 gets larger), the t-distribution approaches the standard normal distribution
T-Critical Values t-distribution curve • We find t* the same way we found z* • t* = t( [1+C]/2, n-1) where n-1 is the Degrees of Freedom (df), based on sample size, n • When the actual df does not appear in Table C, use the greatest df available that is less than your desired df t* -t*
Match Pair Analysis The parameter, μ, in a paired t procedure is the mean differences in the responses to the • two treatments within matched pairs • two treatments when the same subject receives both treatments • before and after measurements with a treatment applied to the same individuals
Example 11 people addicted to caffeine went through a study measuring their depression levels using the Beck Depression Inventory. Higher scores show more symptoms of depression. During the study each person was given either a caffeine pill or a placebo. The order that they received them was randomized. Construct a 90% confidence interval for the mean change in depression score. Diff 11 18 1 4 6 19 6 3 13 1 -1 Enter the differences into List1 in your calculator
Example 3 cont Parameter: μdiff PE ± MOE Conditions: 1) SRS 2) Normality 3) Independence Not see output below > DOE helps Output from Fathom: similar to our output from the TI
Example 3 cont Calculations: x-bardiff = 7.364 and sdiff = 6.918X-bar ± tα/2,n-1 s / √n 7.364 ± (1.812) (6.918) / √11 7.364 ± 3.780 LB = 3.584 < μdiff < 11.144 = UB Interpretation: We are 90% confident that the true mean difference in depression score for the population lies between 3.6 & 11.1 points (on BDI). That is, we estimate that caffeine-dependent individuals would score, on average, between 3.6 and 11.1 points higher on the BDI when they are given a placebo instead of caffeine. Lack of SRS prevents generalization any further.
Random Reminders • Random selection of individuals for a statistical study allows us to generalize the results of the study to the population of interest • Random assignment of treatments to subjects in an experiment lets us investigate whether there is evidence of a treatment effect (caused by observed differences) • Inference procedures for two samples assume that the samples are selected independently of each other. This assumption does not hold when the same subjects are measured twice. The proper analysis depends on the design used to produce the data.
Inference Robustness • Both t and z procedures for confidence intervals are robust for minor departures from Normality • Since both x-bar and s are affected by outliers, the t procedures are not robust against outliers
Z versus t in Reality • When σ is unknown we use t-procedures no matter the sample size (usually asked on AP Exam)
Can t-Procedures be Used? No: this is an entire population, not a sample
Can t-Procedures be Used? Yes: there are 70 observations with a symmetric distribution
Can t-Procedures be Used? Yes: if the sample size is large enough to overcome the right-skewness
TI Calculator Help on t-Interval • Press STATS, choose TESTS, and then scroll down to Tinterval • Select Data, if you have raw data (in a list) Enter the list the raw data is in Leave Freq: 1 aloneor select stats, if you have summary stats Enter x-bar, s, and n • Enter your confidence level • Choose calculate
TI Calculator Help on Paired t-Interval • Press STATS, choose TESTS, and then scroll down to 0-SampTInt • Select Data, if you have raw data (in 2 lists) Enter the lists the raw data is in Leave Freq: 1 aloneor select stats, if you have summary stats Enter x-bar, s, and n for each sample • Enter your confidence level • Choose calculate
Summary and Homework • Summary • In practice we do not know σ and therefore use t-procedures to estimate confidence intervals • t-distribution approaches Standard Normal distribution as the sample size gets very large • Use difference data to analyze paired data using same t-procedures • t-procedures are relatively robust, unless the data shows outliers or strong skewness • Homework #33, 35, 44