Download
1 / 12
160 likes | 477 Views
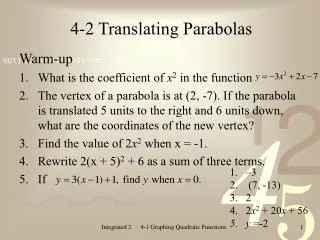
5.3 Translating Parabolas. SWBAT translate parabolas using vertex form. Do Now. Identify the parent function of each function. Then graph the function by translating each parent function. y = |3x| + 2 y = -|x + 1| - 1 Write an equation for each translation. 3. y = |2x|, 2 units down

E N D
5.3 Translating Parabolas SWBAT translate parabolas using vertex form.
Do Now Identify the parent function of each function. Then graph the function by translating each parent function. y = |3x| + 2 y = -|x + 1| - 1 Write an equation for each translation. 3. y = |2x|, 2 units down 4. y = |x|, 4 units up, 1 unit right
Vertex Form (Copy this down) Use multiplication to verify that the functions in each row are equivalent. Compare the values of –b/2a and h in each row. What is their relationship?
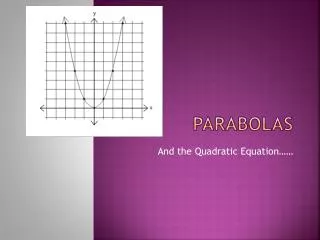
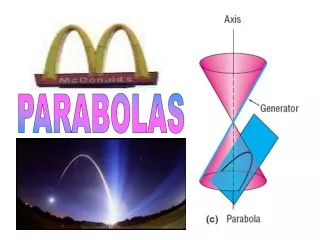
Translating Parabolas In chapter 2 we learned to graph linear and absolute value functions as translations of their parent functions. We can also graph quadratic functions as translations of the parent function: ax2
Vertex Form • Vertex form of a quadratic function: y = a(x – h)2 + k • Parent function is ax2 • Translated h units horizontally and k units vertically • Important notes: • When h is positive the graph shifts right; when h is negative the graph shifts left • When k is positive the graph shifts up; when k is negative the graph shifts down. • The vertex is (h, k) and the axis of symmetry is the line x = h.
Graphing in Vertex Form • Example 1: • Step 1: Graph the vertex. • Step 2: Draw the axis of symmetry. • Step 3: Find another point. • (Hint: Finding x = 0 is the easiest.) • Step 4: Graph the reflection of that point. • Step 5: Sketch the curve.
Example 2 Graph y = 2(x + 1)2 – 4.
Writing the Equation of the Parabola You can use the vertex form to write the equation of a parabola. Substitute values for h, k, and a point (x, y). Then solve for a.
Example Vertex: (3, 4) Point: (5, -4)
Converting to Vertex Form Example 1: Write in vertex form. Step1: Find the vertex. Step 2: Since the vertex is a point on the parabola, we can substitute the x and y values of the vertex in for h and k. Step 3: Substitute for a, h, and k. Step 4:Simplify.
Example 2 Write y = -3x2 + 12x + 5 in vertex form.
Civil Engineering The Verrazano-Narrows bridge in New York has the longest span of any suspension bridge in the United States. A suspension cable of the bridge forms a curve that resembles a parabola. The curve can be modeled with the function y = 0.0001432(x – 2130)2 Where x and y are measured in feet. The origin of the function’s graph is at the base of one of the two towers that support the cable. How far apart are the two towers? How high are they? Start by drawing a diagram. What is the vertex? Can we tell how far apart the towers are? How can we find the height?