Download
1 / 55
550 likes | 556 Views
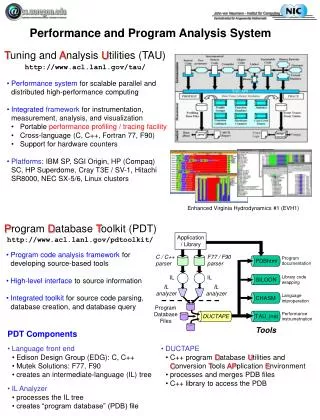
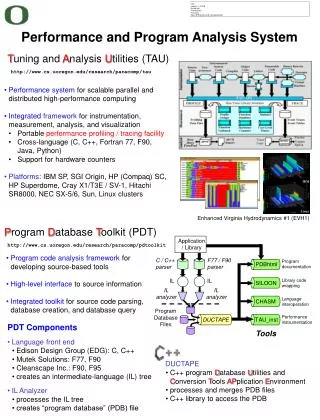
Performance Technology for Complex Parallel and Distributed Systems. Allen D. Malony , Sameer Shende {malony,sameer}@cs.uoregon.edu Computer & Information Science Department Computational Science Institute University of Oregon. Performance Needs Performance Technology.

E N D
Performance Technology for ComplexParallel and Distributed Systems Allen D. Malony, Sameer Shende {malony,sameer}@cs.uoregon.edu Computer & Information Science Department Computational Science Institute University of Oregon
Performance Needs Performance Technology • Observe/analyze/understand performance behavior • Multiple levels of software and hardware • Different types and detail of performance data • Alternative performance problem solving methods • Multiple targets of software and system application • Robust AND ubiquitous performance technology • Broad scope of performance observability • Flexible and configurable mechanisms • Technology integration and extension • Cross-platform portability • Open layered and modular framework architecture
Complexity Challenges • Computing system environment complexity • Observation integration and optimization • Access, accuracy, and granularity constraints • Diverse/specialized observation capabilities/technology • Restricted modes limit performance problem solving • Sophisticated software development environments • Programming paradigms and performance models • Performance data mapping to software abstractions • Uniformity of performance abstraction across platforms • Rich observation capabilities and flexible configuration • Common performance problem solving methods
General Problem How do we create robust and ubiquitous performance technology for the analysis and tuning of parallel and distributed software and systems in the presence of (evolving) complexity challenges?
Talk Outline • Complexity and Performance Technology • Computation Model for Performance Technology • TAU Performance Framework • Model-oriented framework architecture • TAU performance system toolkit • Complexity Scenarios • Multi-threaded execution • Virtual machine environments • Distributed message passing systems • Hierarchical, hybrid parallel systems • Future Work and Conclusions
Computation Model for Performance Technology • How to address dual performance technology goals? • Robust capabilities + widely available methodologies • Contend with problems of system diversity • Flexible tool composition/configuration/integration • Approaches • Restrict computation types / performance problems • limited performance technology coverage • Base technology on abstract computation model • general architecture and software execution features • map features/methods to existing complex system types • develop capabilities that can adapt and be optimized
Framework for Performance Problem Solving • Model-based composition • Instrumentation / measurement / execution models • performance observability constraints • performance data types and events • Analysis / presentation model • performance data processing • performance views and model mapping • Integration model • performance tool component configuration / integration • Can performance problem solving framework be designed based on general complex system model?
General Complex System Computation Model • Node:physically distinct shared memory machine • Message passing node interconnectionnetwork • Context: distinct virtual memory space within node • Thread: execution threads (user/system) in context Network Node Node Node node memory memory memory SMP VM space … … Context Threads
TAU Performance Framework • Tuning and Analysis Utilities • Performance system framework for scalable parallel and distributed high-performance computing • Targets a general complex system computation model • nodes / contexts / threads • multi-level: system / software / parallelism • measurement and analysis abstraction • Integrated toolkit for performance instrumentation, measurement, analysis, and visualization • portable performance profiling/tracing facility • open software approach
TAU Architecture Dynamic
TAU Instrumentation • Flexible, multiple instrumentation mechanisms • Source code • manual • automatic using PDT (tau_instrumentor) • Object code • pre-instrumented libraries • statically linked • dynamically linked • Executable code • dynamic instrumentation using DynInstAPI (tau_run)
TAU Instrumentation (continued) • Common target measurement interface (TAU API) • C++ (object-based) design and implementation • Macro-based, using constructor/destructor techniques • Function, classes, and templates • Uniquely identify functions and templates • name and type signature (name registration) • static object creates performance entry • dynamic object receives static object pointer • runtime type identification for template instantiations • C and Fortran instrumentation variants • Instrumentation and measurement optimization
TAU Measurement • Performance information • High resolution timer library (real-time / virtual clocks) • Generalized software counter library • Hardware performance counters • PCL (Performance Counter Library) (ZAM, Germany) • PAPI (Performance API) (UTK, Ptools Consortium) • consistent, portable API • Organization • Node, context, thread levels • Profile groups for collective events (runtime selective) • Mapping between software levels
TAU Measurement (continued) • Profiling • Function-level, block-level, statement-level • Supports user-defined events • TAU profile (function) database (PD) • Function callstack • Hardware counts instead of time • Tracing • Profile-level events • Interprocess communication events • Timestamp synchronization • User-controlled configuration (configure)
TAU Analysis • Profile analysis • Pprof • parallel profiler with texted based display • Racy • graphical interface to pprof • Trace analysis • Trace merging and clock adjustment (if necessary) • Trace format conversion (ALOG, SDDF, PV, Vampir) • Vampir (Pallas)
TAU Status • Usage (selective) • Platforms • IBM SP, SGI Origin 2K, Intel Teraflop, Cray T3E, HP, Sun, Windows 95/98/NT, Alpha/Pentium Linux cluster • Languages • C, C++, Fortran 77/90, HPF, pC++, HPC++, Java • Communication libraries • MPI, PVM, Nexus, Tulip, ACLMPL • Thread libraries • pthreads, Tulip, SMARTS, Java,Windows • Compilers • KAI, PGI, GNU, Fujitsu, Sun, Microsoft, SGI, Cray
TAU Status (continued) • Application libraries • Blitz++, A++/P++, ACLVIS, PAWS • Application frameworks • POOMA, POOMA-2, MC++, Conejo, PaRP • Other projects • ACPC, University of Vienna: Aurora • UC Berkeley (Culler): Millenium, sensitivity analysis • KAI and Pallas • TAU profiling and tracing toolkit (Version 2.8 beta) • Extensive 70-page TAU User’s Guide • http://www.cs.uoregon.edu/research/paracomp/tau
Complexity Scenarios • Multi-threaded execution • Abstract thread-based performance measurement • Virtual machine environments • Performance instrumentation in virtual machine • Measurement of multi-level virtual machine events • Distributed message passing computation • Performance measurement message passing library • Integration with multi-threading • Hierarchical, hybrid parallel systems • Portable shared memory and message passing APIs • Combined task and data parallel execution • Performance system configuration and model mapping
Multi-Threading Performance Measurement • Fine-grained parallelism • Different forms and levels of threading • Greater need for efficient instrumentation • Issues • Thread identity and per-thread data storage • Performance measurement support and synchronization • TAU general threading and measurement model • Common thread layer and measurement support • Interface to system specific libraries (reg, id, sync) • Target different thread systems with core functionality • Pthreads, Windows, Java, SMARTS, Tulip
Multi-Threading in Java • Profile and trace Java (JDK 1.2+) applications • Observe user-level and system-level threads • Observe events for different Java packages • /lang, /io, /awt, … • Test application • SciVis, NPAC, Syracuse University % ./configure -jdk=<dir_where_jdk_is_installed> % setenv LD_LIBRARY_PATH $LD_LIBRARY_PATH\:<taudir>/<arch>/lib % java -XrunTAU svserver
TAU Profiling of Java Application (SciVis) 24 threads of execution! Profile for eachJava thread Captures eventsfor different Javapackages
TAU Tracing of Java Application (SciVis) Performance groups Timeline display Parallelism view
Vampir Dynamic Call Tree View (SciVis) Per thread call tree Expandedcall tree Annotated performance
Virtual Machine Environments (Java) • Integrate performance system with VM system/apps • Captures robust performance data • Maintain features of environment • portability, concurrency, extensibility, interoperation • Java • No need to modify Java source, bytecode, or JVM • Implemented using JVMPI (JVM profiling interface) • fields JVMPI events • Executes in memory space of JVM • profiler agent loaded as shared object
Thread API TAU Java Instrumentation Architecture Java program TAU package JNI Event notification TAU JVMPI Profile DB
Distributed Message Passing (MPI) • Performance measurement of communication events • Integrate with application events • Multi-language applications execution • C, C++, Fortran, Java • mpiJava (Syracuse, JavaGrande) • Java wrapper package with JNI C bindings to MPI • Integrate cross-language/system technology • JVMPI and Tau profiler agent • MPI profiling interface - link-time interposition library • Cross execution mode uniformity and consistency • invoke JVMPI control routines to control Java threads • access thread information and expose to MPI interface
Thread API TAU Java Instrumentation Architecture Java program mpiJava package TAU package JNI MPI profiling interface Event notification TAU TAU wrapper Native MPI library JVMPI Profile DB
Parallel Java Game of Life (Profile) Merged Java and MPI event profiles • mpiJavatestcase • 4 nodes,28 threads Thread 4 executes all MPI routines Node 0 Node 1 Node 2
Integrated event tracing Mergedtrace viz Nodeprocessgrouping Threadmessagepairing Vampirdisplay Multi-level event grouping Parallel Java Game of Life (Trace)
Hierarchical, Hybrid Parallel Systems (Opus/HPF) • Hierarchical, hybrid programming and execution model • Multi-threaded SMP and inter-node message passing • Integrated task and data parallelism • Opus / HPF environment (University of Vienna) • Combined data (HPF) and task (Opus) parallelism • HPF compiler produces Fortran 90 modules • Processes interoperate using Opus runtime system • producer / consumer model • MPI and pthreads • Performance influence at multiple software levels • Performance analysis oriented to programming model
Opus / HPF Execution Trace • 4-node, 28 process: consumers, producers • Process-grouping in Vampir visualization
Hybrid Parallel Computation (OpenMPI + MPI) • Portable hybrid parallel programming • OpenMP for shared memory parallel programming • Fork-join model • Loop level parallelism • MPI for cross-box message-based parallelism • OpenMP performance measurement • Interface to OpenMP runtime system (RTS events) • Compiler support and integration • 2D Stommel model of ocean circulation • Jacobi iteration, 5-point stencil • Timothy Kaiser (San Diego Supercomputing Center)
OpenMP + MPI Ocean Modeling (Trace) Threadmessagepairing IntegratedOpenMP +MPI events
OpenMP + MPI Ocean Modeling (HW Profile) % configure -papi=../packages/papi -openmp -c++=pgCC -cc=pgcc -mpiinc=../packages/mpich/include -mpilib=../packages/mpich/libo IntegratedOpenMP +MPI events FP instructions
Summary • Complex parallel computing environments require robust and widely available performance technology • Portable, cross-platform, multi-level, integrated • Able to bridge and reuse existing technology • Technology savvy and open • TAU is only a performance technology framework • General computation model and core services • Mapping, extension, and refinement • Integration of additional performance technology • Need for higher-level framework layers • Computational and performance model archetypes • Performance diagnosis
TAU Future Plans • Platforms • IA-64 (!), Compaq ASCI Q, Sun Starfire, Linux SC • Languages • OpenMP + MPI, Java (Java Grande), Opus / Java • Instrumentation • Automatic source (F90, Java), DynInst, DPCL, DITools • Measurement • Extend tracing support to include event data (e.g., HW counts) • Dynamic performance measurement control • Displays • Extensible Performance Display Tool (ExPeDiTo) • TraceView 2 (TV2), Pajé • Performance database and technology • Support for multiple runs • Open API for analysis tool development
Open Performance Technology (OPT) • Performance problem is complex • diverse platforms, software development, applications • things evolve • History of incompatible and competing tools • instrumentation / measurement technology reinvention • lack of common, reusable software foundations • Need “Value added” (open) approach • technology for high-level performance tool development • layered performance tool architecture • portable, flexible, programmable, integrative technology • Opportunity for performance technology integration in industry and across HPC software projects
TAU Measurement API • Configuration • TAU_PROFILE_INIT(argc, argv);TAU_PROFILE_SET_NODE(myNode);TAU_PROFILE_SET_CONTEXT(myContext);TAU_PROFILE_EXIT(message); • Function and class methods • TAU_PROFILE(name, type, group); • Template • TAU_TYPE_STRING(variable, type);TAU_PROFILE(name, type, group);CT(variable); • User-defined timing • TAU_PROFILE_TIMER(timer, name, type, group);TAU_PROFILE_START(timer);TAU_PROFILE_STOP(timer);
TAU Measurement API (continued) • User-defined events • TAU_REGISTER_EVENT(variable, event_name);TAU_EVENT(variable, value);TAU_PROFILE_STMT(statement); • Mapping • TAU_MAPPING(statement, key);TAU_MAPPING_OBJECT(funcIdVar);TAU_MAPPING_LINK(funcIdVar, key); • TAU_MAPPING_PROFILE (FuncIdVar);TAU_MAPPING_PROFILE_TIMER(timer, FuncIdVar);TAU_MAPPING_PROFILE_START(timer);TAU_MAPPING_PROFILE_STOP(timer); • Reporting • TAU_REPORT_STATISTICS();TAU_REPORT_THREAD_STATISTICS();
C++ Template Instrumentation (Blitz++, PETE) • High-level objects • Array classes • Templates (Blitz++) • Optimizations • Array processing • Expressions (PETE) • Relate performance data to high-level statement • Complexity of template evaluation Array expressions
Standard Template Instrumentation Difficulties • Instantiated templates result in mangled identifiers • Standard profiling techniques / tools are deficient • Integrated with proprietary compilers • Specific systems platforms and programming models Uninterpretable routine names
TAU Instrumentation and Profiling Profile ofexpressiontypes Performance data presentedwith respect to high-levelarray expression types Graphical pprof
TAU and SMARTS: Asynchronous Performance • Scalable Multithreaded Asynchronuous RTS • User-level threads, light-weight virtual processors • Macro-dataflow, asynchronous execution interleaving iterates from data-parallel statements • Integrated with POOMA II (parallel dense array library) • Measurement of asynchronous parallel execution • Utilized the TAU mapping API • Associate iterate performance with data parallel statement • Evaluate different scheduling policies • “SMARTS: Exploting Temporal Locality and Parallelism through Vertical Execution” (ICS '99)
TAU Mapping of Asynchronous Execution Without mapping Two threadsexecuting With mapping POOMA / SMARTS
With and without mapping (Thread 0) Without mapping Thread 0 blockswaiting for iterates Iterates get lumped together With mapping Iterates distinguished
With and without mapping (Thread 1) Array initialization performance lumped Without mapping Performance associated with ExpressionKernel object With mapping Iterate performance mapped to array statement Array initialization performancecorrectly separated
TAU Profiling of SMARTS Scheduling Iteration scheduling for two array expressions
SMARTS Tracing (SOR) – Vampir Visualization • SCVE scheduler used in Red/Black SOR running on 32 processors of SGI Origin 2000 Asynchronous, overlapped parallelism
TAU Distributed Monitoring Framework • Extend usability of TAU performance analysis • Access TAU performance data during execution • Framework model • each application context is a performance data server • monitor agent thread is created within each context • client processes attach to agents and request data • server thread synchronization for data consistency • pull mode of interaction • Distributed TAU performance data space • “A Runtime Monitoring Framework for the TAU Profiling System” (ISCOPE ‘99)