Download
1 / 59
840 likes | 1.73k Views
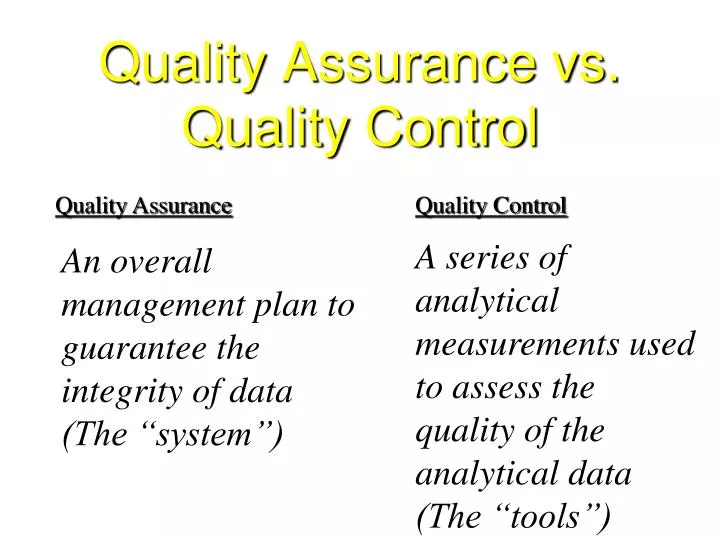
Quality Assurance vs. Quality Control. Quality Assurance. Quality Control. A series of analytical measurements used to assess the quality of the analytical data (The “tools”). An overall management plan to guarantee the integrity of data (The “system”). True Value

E N D
Quality Assurance vs. Quality Control Quality Assurance Quality Control A series of analytical measurements used to assess the quality of the analytical data (The “tools”) An overall management plan to guarantee the integrity of data (The “system”)
True Value The known, accepted value of a quantifiable property Measured Value The result of an individual’s measurement of a quantifiable property True Value vs. Measured Value
Accuracy How well a measurement agrees with an accepted value Precision How well a series of measurements agree with each other Accuracy vs. Precision
Systematic Error Avoidable error due to controllable variables in a measurement. Random Errors Unavoidable errors that are always present in any measurement. Impossible to eliminate Systematic vs. Random Errors
Blanks, Blanks, Blanks • Laboratory Reagent Blanks • Instrument Blanks • Field Reagent Blanks • Trip Blanks
Laboratory Reagent Blanks • Contains every reagent used in the analysis • Is subjected to all analytical procedures • Must give signal below detection limit • Most methods require one with every batch
Instrument Blank • A clean sample (e.g., distilled water) processed through the instrumental steps of the measurement process; used to determine instrument contamination.
Field Reagent Blanks • Prepared in the lab, taken to the field • Opened at the sampling site, exposed to sampling equipment, returned to the lab.
Trip Blanks • Prepared in the lab, taken to the field • Not opened • Returned to the lab • Not always required in EPA methods
Recovery Studies • Matrix Spikes • Laboratory Control Samples • Surrogates .
Matrix Spikes • Sample spiked with a known amount of analyte • Subjected to all sample prep and analytical procedures • Determines the effect of the matrix on analyte recovery • Normally one per batch
Laboratory Control Sample • Analyte spiked into reagent water • Subjected to all sample prep and • analytical procedures
Laboratory Control Sample Also known as: • Laboratory Fortified Blank (LFB) • Quality Control Sample (QCS)
Surrogates • Similar to an internal standard • Added to all analytical samples, and to all QC samples to monitor method performance, usually during sample prep • Methods often have specific surrogate recovery criteria • Most common in Organic methods
COCOMO Models R.L. Probert
Project Management and Mr. Murphy • Logic is a systematic method of coming to the wrong conclusion with confidence. • Technology is dominated by those who manage what they do not understand. • Nothing ever gets built on schedule or within budget. • If mathematically you end up with the incorrect answer, try multiplying by the page number. R.L. Probert
Motivation The software cost estimation provides: • the vital link between the general concepts and techniques of economic analysis and the particular world of software engineering. • Software cost estimation techniques also provides an essential part of the foundation for good software management. R.L. Probert
Cost of a project • The cost in a project is due to: • due the requirements for software, hardware and human resources • the cost of software development is due to the human resources needed • most cost estimates are measured in person-months (PM) R.L. Probert
Cost of a project (.) • the cost of the project depends on the nature and characteristics of the project, at any point, the accuracy of the estimate will depend on the amount of reliable information we have about the final product. R.L. Probert
Software Cost Estimation R.L. Probert
Introduction to COCOMO models • The COstructive COst Model (COCOMO) is the most widely used software estimation model in the world. It • The COCOMO model predicts theeffortand duration of a project based on inputs relating to the size of the resulting systems and a number of "cost drives" that affect productivity. R.L. Probert
Effort • Effort Equation • PM = C * (KDSI)n (person-months) • where PM = number of person-month (=152 working hours), • C = a constant, • KDSI = thousands of "delivered source instructions" (DSI) and • n = a constant. R.L. Probert
Productivity • Productivity equation • (DSI) / (PM) • where PM = number of person-month (=152 working hours), • DSI = "delivered source instructions" R.L. Probert
Schedule • Schedule equation • TDEV = C * (PM)n (months) • where TDEV = number of months estimated for software development. R.L. Probert
Average Staffing • Average Staffing Equation • (PM) / (TDEV) (FSP) • where FSP means Full-time-equivalent Software Personnel. R.L. Probert
COCOMO Models • COCOMO is defined in terms of three different models: • the Basic model, • the Intermediate model, and • the Detailed model. • The more complex models account for more factors that influence software projects, and make more accurate estimates. R.L. Probert
The Development mode • the most important factors contributing to a project's duration and cost is the Development Mode • Organic Mode: The project is developed in a familiar, stable environment, and the product is similar to previously developed products. The product is relatively small, and requires little innovation. • Semidetached Mode: The project's characteristics are intermediate between Organic and Embedded. R.L. Probert
The Development mode • the most important factors contributing to a project's duration and cost is the Development Mode: • Embedded Mode: The project is characterized by tight, inflexible constraints and interface requirements. An embedded mode project will require a great deal of innovation. R.L. Probert
Modes R.L. Probert
Modes (.) R.L. Probert
Cost Estimation Process Cost=SizeOfTheProject x Productivity R.L. Probert
Cost Estimation Process Effort Size Table Lines of Code Number of Use Case Function Point Development Time Estimation Process Number of Personnel Errors R.L. Probert
Project Size - Metrics • Number of functional requirements • Cumulative number of functional and non-functional requirements • Number of Customer Test Cases • Number of ‘typical sized’ use cases • Number of inquiries • Number of files accessed (external, internal, master) • Total number of components (subsystems, modules, procedures, routines, classes, methods) • Total number of interfaces • Number of System Integration Test Cases • Number of input and output parameters (summed over each interface) • Number of Designer Unit Test Cases • Number of decisions (if, case statements) summed over each routine or method • Lines of Code, summed over each routine or method R.L. Probert
Development Phase Available Metrics a Requirements Gathering 1, 2, 3 b Requirements Analysis 4, 5 d High Level Design 6, 7, 8, 9 e Detailed Design 10, 11, 12 f Implementation 12, 13 Project Size – Metrics(.) Availability of Size Estimation Metrics: R.L. Probert
Function Points • STEP 1: measure size in terms of the amount of functionality in a system. Function points are computed by first calculating an unadjusted function point count (UFC). Counts are made for the following categories • ·External inputs – those items provided by the user that describe distinct application-oriented data (such as file names and menu selections) • ·External outputs – those items provided to the user that generate distinct application-oriented data (such as reports and messages, rather than the individual components of these) R.L. Probert
Function Points(.) • · External inquiries – interactive inputs requiring a response • · External files – machine-readable interfaces to other systems • · Internal files – logical master files in the system R.L. Probert
Function Points(..) • STEP 2: Multiply each number by a weight factor, according to complexity (simple, average or complex) of the parameter, associated with that number. The value is given by a table: R.L. Probert
Function Points(...) • STEP 3: Calculate the total UFP (Unadjusted Function Points) • STEP 4: Calculate the total TCF (Technical Complexity Factor) by giving a value between 0 and 5 according to the importance of the following points: R.L. Probert
Function Points(....) • Technical Complexity Factors: • 1. Data Communication • 2. Distributed Data Processing • 3. Performance Criteria • 4. Heavily Utilized Hardware • 5. High Transaction Rates • 6. Online Data Entry • 7. Online Updating • 8. End-user Efficiency • 9. Complex Computations • 10. Reusability • 11. Ease of Installation • 12. Ease of Operation • 13. Portability • 14. Maintainability R.L. Probert
Function Points(.....) • STEP 5: Sum the resulting numbers too obtain DI (degree of influence) • STEP 6: TCF (Technical Complexity Factor) by given by the formula • TCF=0.65+0.01*DI • STEP 6: Function Points are by given by the formula • FP=UFP*TCF R.L. Probert
Example R.L. Probert
Example (.) R.L. Probert
Example (..) • Technical Complexity Factors: • 1. Data Communication 3 • 2. Distributed Data Processing 0 • 3. Performance Criteria 4 • 4. Heavily Utilized Hardware 0 • 5. High Transaction Rates 3 • 6. Online Data Entry 3 • 7. Online Updating 3 • 8. End-user Efficiency 3 • 9. Complex Computations 0 • 10. Reusability 3 • 11. Ease of Installation 3 • 12. Ease of Operation 5 • 13. Portability 3 • 14. Maintainability 3 • DI =30 (Degree of Influence) R.L. Probert
Example (…) • Function Points • FP=UFP*(0.65+0.01*DI)= 55*(0.65+0.01*30)=52.25 • That means the is FP=52.25 R.L. Probert
Relation between LOC and FP • Relationship: • LOC = Language Factor * FP • where • LOC (Lines of Code) • FP (Function Points) R.L. Probert
Relation between LOC and FP(.) Assuming LOC’s per FP for: Java = 53, C++ = 64 aKLOC = FP * LOC_per_FP / 1000 It means for the SpellChekcer Example: (Java) LOC=52.25*53=2769.25 LOC or 2.76 KLOC R.L. Probert
Effort Computation • The Basic COCOMO model computes effort as a function of program size. The Basic COCOMO equation is: • E = aKLOC^b • Effort for three modes of Basic COCOMO. R.L. Probert
Example R.L. Probert