Download
1 / 22
220 likes | 338 Views
MEG DCH Analysis. W. Molzon For the DCH Analysis Working Group. MEG Review Meeting 18 February 2009. Outline. Impact on MEG performance Analysis algorithms DCH Calibration DCH position resolutions: R f and q Positron reconstruction Momentum Position and angle at target

E N D
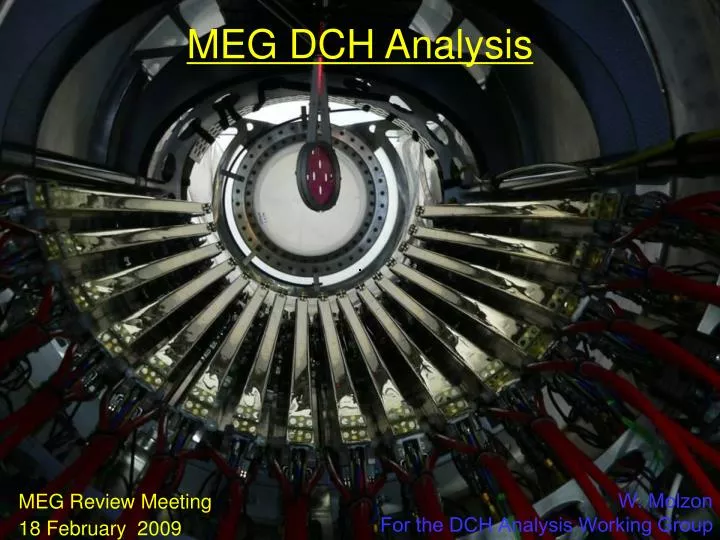
MEG DCH Analysis W. Molzon For the DCH Analysis Working Group MEG Review Meeting 18 February 2009 DCH Analysis
Outline • Impact on MEG performance • Analysis algorithms • DCH Calibration • DCH position resolutions: Rf and q • Positron reconstruction • Momentum • Position and angle at target • Projection to timing counters • DCH efficiency • Required improvements in analysis • Drift model • Reducing noise and its impact on resolution • Improved tracking efficiency with lower than expected DCH efficiency • Fitting DCH Analysis
Positron Spectrometer Impact on MEG Performance • Select on positron energy within interval near52.8 MeV • For fixed m→eg acceptance, BG/S proportional to dp (MEG prediction sRMS=180 keV/c) • Select on qeg near p • For fixed acceptance, BG/S proportional to df x dq (MEG prediction sRMS = 8x8 mrad2) • photon position resolution ~ 6 mm sRMS ~9 mrad both f and q • Track fittingangle uncertainty 12 mrad f, 6 mrad q • Position of stopping target: uncertainty 0.5 mm ~6 mrad f • Project to target and timing counter and correct te for propagation delay • For fixed acceptance, BG/S proportional to dt (MEG prediction sRMS = 64 ps, ~2 cm) • Projection to target has negligible uncertainty • Uncertainty in timing counter projection dominated by scattering and E loss after spectrometer • Improvements needed from incorporating position at timing counter and material between spectrometer and timing counter into fit. • For all effects, tails in resolution function loss of acceptance proportional to integral in tail, small increase in background because source of background is uniform DCH Analysis
Tracking Analysis • Outline of algorithms • Extract hits from waveform on each cell: two anode ends, four pads • Extract hit position in Rf from hit time and in Z from anode and pad charges • Form clusters of hits on a particular chamber coming from single particle • Form track candidates from groups of hits consistent with Michel positron • Fit the hits from track candidates to form tracks DCH Analysis
Waveform Analysis Based on waveforms on 2 anode ends and 4 pads associated with each cell waveform noise limits resolution DRS voltage calibrated with on-board constant voltage presented to input of DRS DRS time calibrated with off-board sine-wave of known frequency presented to each board. Bin-by-bin time calibration done for each DRS channel (~2x10⁵ points) Readout rate dependent baseline offset for some DRS bins not corrected, trigger waveform crosstalk onto DRS not corrected – hardware improvements anticipated Improvement in noise level would significantly improve resolution DCH Analysis
DCH Calibrations and Corrections • Alignment of chambers – radial offsets, z offsets, chamber tilts • All from fits to Michel data • Typical systematic residuals after alignment small ( < 100 mm) • Calibration of preamp gains, effective wire length • Use known periodicity of cathode pads to calibrate anode preamp gains, input impedance, wire resistivity that affects anode z position • Calibrate relative gains of cathode pads by ratio of signal on two ends of pads to sine function with variable relative gain • Correct drift times for signal propagation on wire – reduce dispersion on time difference between two ends by ~20% • Identify and correct for incorrect pad cycle assignment due to errors in anode Z position exceeding 2.5 cm • Measure effect of noise on pad charge measurements on Z resolution – optimize integration time to minimize effect of noise DCH Analysis
Hit Finding • Smooth waveforms to reduce high frequency noise • Determine constant baseline offset event-by-event for each waveform • Only time before hit used; small slope from earlier hits not corrected • Find max peak in anode waveform – iterate after removing signal in peak • Integrate around peak in limited time interval to get 2 anode, 6 pad charges– optimized to minimize impact of noise on charge integration: typically 50 ns. • Get hit time from simple threshold discriminator on unsmoothed waveform – correct for propagation along wire using Z coordinate • Get Z first from anode charge division, then from interpolation with pads Time difference two ends DCH Analysis
Cluster Finding Find group of hits consistent with coming from single charge particle Start with groups of hits in contiguous wires on chamber Split clusters that have hits at inconsistent Z locations Identify and fix clusters that have hits separated in Z by one pad cycle (5 cm) due to incorrect anode Z position Reassess assignment of hits to clusters during track-finding, when track angle at the cluster is known After all clusters with > 1 hit are found, assign unmatched hits as “single hit clusters” Single hit clusters Correct wrong pad cycle 3,4 hit clusters DCH Analysis
Track Candidate Finding Find group of clusters consistent with coming from single charge particle with fixed momentum going through spectrometer Self-contained code, independent of TIC (i.e. for track time) Start with seed with 3 clusters in 4 adjacent chambers at R>Rmin Given a seed, propagate in both directions, adding hits within range in dR and dZ consistent with Michel momentum At each stage, determine track candidate time from drift times Consistent radial coordinate, consistent Z coordinate Track time that minimizes residual of hit positions to local helix fit L/R resolution by minimizing deviations from local helix fit Hits can be removed from clusters at tracking stage DCH Analysis
Track Fitting • Kalman filter using hits found by trackfinder • Uses fully aligned chamber coordinates from optical alignment + software alignment • Use hit-by-hit uncertainty in Rf and Z coordinates parameterized as function of hit charge, magnitude of drift distance (determined from data) • Phenomenological corrections to drift time vs. drift distance based on parameterization of data • Removes hits that are inconsistent with positron trajectory • Group of clusters consistent with coming from single charge particle with fixed momentum going through spectrometer • Optimization of fitting algorithm for sparse hits to be done • Incorporation of TIC position into filter to improve trajectory after spectrometer to be done DCH Analysis
Intrinsic Drift Chamber Performance from Tracking sRMS=1.61 (z1 – z2)/ √(σ2z1+ σ2z2) • Rf position resolution • Look at difference in hits in 2 planes in chamber projected to central plane using trajectory information: insensitive to multiple scattering • Typical spatial resolution of 260 microns • Systematic effects with drift distance and angle – ad-hoc corrections applied dr for opposite side more sensitive to errors in track time sRMS of central region ~260 mm non-Gaussian tails, larger for opposite side hits • Z position resolution • Similar technique to that for Rf resolution Inferred sz = 0.15 cm Za-Zb normalized Za-Zb Za-Zb vs charge DCH Analysis
Definition of Selection Criteria for Tracking Efficiency, Resolution Tight Cuts have additional requirements Nhits > 9, dE < 0.0006 DCH Analysis
Momentum Resolution from Monte Carlo sRMS=420 keV sRMS=420 keV • No source of fixed momentum particles – fit to edge of Michel spectrum, first MC • Generate Michel spectrum, including radiative decays – in this study without inefficiencies • Fit convolution of generated MC spectrum with single Gaussian to reconstructed MC spectrum • Fit range (51.5-54.0) MeV/c • Done for “tight cuts” • Resolution worse than original MEG predictions: DRS noise + ? • Tails from large angle scattering, pattern recognition?, others? DCH Analysis
Momentum Resolution from Data • No source of fixed momentum particles to measure response function • Fit to edge of Michel spectrum to demonstrate resolution • Generate Michel spectrum with radiative corrections • Impose momentum dependence of TIC acceptance x efficiency – measured using DCH triggered data • Fit measured energy distribution to convolution of acceptance-corrected Michel spectrum and hypothetical resolution function • Edge of spectrum most sensitive to Gaussian part of resolution function – fit of high energy tail very dependent on model for tail in resolution function • Currently worse than MC by a factor of 2, but inefficiencies not yet in MC resolution fits early datasRMS = 830 keV tight cuts, early datasRMS = 772 keV late datasRMS = 1002 keV tight cuts, late datasRMS = 795 keV DCH Analysis
Check of Angular Resolution Monte Carlo Calculated uncertainty in q, data 6 mrad Calculated uncertainty in f, data12 mrad Data f~0 Data f>0 Data f<0 • No source of positrons of known direction • Fitting provides event-by-event estimate of dq, df • Target designed with holes to test of resolution in projection to the target infer dq, df • Take slice in target projection around hole, try to match depth of dip data to MC • Position of hole vs. angle of track with respect to target normal sensitive to target position • Difficult to quantitatively match distributions • Beam spot has different shape • Hole on falling distribution • Work in progress • First try requires increasing resolution in dZ, dY by 50% • Position of hole good to at least 1 mm – neglibible contribution to qeg uncertainty DCH Analysis
Project to TIC, Require Space and Time Match, Calculate Propagation Time • Need to correct for track propagation delay to precision of 50 ps track length to 1.5 cm • Trajectory known from target plane through spectrometer to very good precision • Projection to TIC complicated by material after spectrometer causing scattering, energy loss • Currently, project to fixed f of timing counter with signal using propagation of Kalman state vector • No correction for mismatch with reconstructed position in timing counter • Typical propagation distance is of order 1 m • Systematic uncertainties in dR, dZ seen, of order 1 cm • First attempts at simple corrections to path-length based on dR, dZ not successful • Fully corrected photon-positron timing difference currently at level of 150 ps in RD signal with photon energy above 40 MeV DCH Analysis
Use DCH Data and Analysis to Study Timing Counter Loose matching criteria Tighter position match, timing criteria • Use DCH trigger data • Require 4 hits in 5 contiguous chambers • Run standard analysis, positron selection criteria • Measure probability of having a TIC hit DCH Analysis
Tracking Efficiency From Monte Carlo • Put actual typical patterns of inefficient chambers into Monte Carlo • Generate signal events over extended region |f| < 1, cos(q) < 0.45 • Define efficiency as (# positrons accepted in fiducial region) (# positrons generated in fiducial region) • Efficiency loss due to track-finding and fitting requirements: • <2 missing chambers in seed • at least one chamber with 2 planes in seed • <2 missing chamber in track extension each direction • at least 8 hits on fitted track • difficulty with getting track time and resolving L/R ambiguity with many single plane chambers DCH Analysis
Reconstructed Tracks per Trigger arrows correspond to typical configurations • Look at fraction of events with at least one reconstructed track at high momentum – measure of relative (not absolute) tracking efficiency • Absolute scale depends on trigger purity, other factors not relevant to DCH performance DCH Analysis
Can We Estimate Tracking Efficiency from Data • Use highly pre-scaled timing counter trigger data • ~ 6000 C total live protons on target 2.8 x 10⁷m/s/2mA (assume livetimesame for MEG, other triggers Implies ~ 8400 x 1010 total muon stops Nm→enn= 11895 satisfying selection cuts counted = 8.4x10¹³ Number of muon stops calculated X 107prescale factor known X 0.30 TIC acceptance x efficiency for Michel measured X 0.182 fraction of Michel spectrum > 48 MeV calculated X (0.92-1.0) conditional trigger efficiency for TIC measured* X 0.091 Michel geometric acceptance assumed XeDCH drift chamber reconstruction & cuts unknown eDCH = 11895 x 107 / 0.3 / 0.182 / 0.92 / 0.091 / 8.4 / 1013 = 0.28-0.31
Conclusions • Tracking efficiency in current run is poor, mostly due to chamber performance • Intrinsic resolutions are not as good as expected • Rf resolution close to expectations, but tails are more than originally anticipated • time-distance relationship • operation at less than optimal voltages • noise • perhaps other causes • Z resolution significantly worse than planned, almost all due to noise • Momentum resolution not as good as expected with measured Gaussian uncertainties as input to fitter • reflection of tails in Rf and Z resolution • reduced number of hits and shorter tracks • full inefficiencies not yet represented in MC DCH Analysis
Conclusions • DCH analysis currently adequate for data with MEG sensitivity of order few x 10-12 • Find radiative decay signal requiring track projecting to timing counter hit, timing correction for track propagation • Trigger on and reconstruct with good precision Michel positrons to help with calibration and understanding of TIC performance • Reduced background rejection due to reduced momentum resolution adequate at current MEG sensitivity to m→eg • Significant improvement in MEG sensitivity per day of running can be achieved • Improvements in central part of resolution function • improved chamber efficiency (hardware) • some (non-trivial) tuning reduction of background by 1/2 • Improved noise performance (hardware) additional background reduction by 1/2 • Higher chamber efficiency will increase reconstruction efficiency increase in sensitivity per day by 3 • Strong effort is needed to achieve MEG sensitivity goal DCH Analysis