Download
1 / 8
80 likes | 153 Views
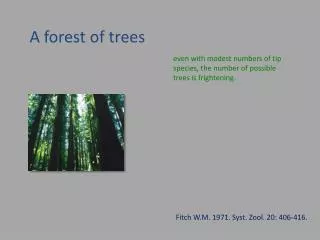
Visualization of a Forest System. Jennifer Hill 2007 Eco-Informatics Summer Institute Oregon State University. Into this:. The Goal. Turn this:. Why visualize data?. Easier to understand Reveals trends Communicate with the public …It’s a three dimensional world!. VS. The Data Set.

E N D
Visualization of a Forest System Jennifer Hill 2007 Eco-Informatics Summer Institute Oregon State University
Into this: The Goal Turn this:
Why visualize data? • Easier to understand • Reveals trends • Communicate with the public …It’s a three dimensional world! VS.
The Data Set • LTER Reference Stands • Multiple years and locations • Detail-rich • Data processing • Calculate heights • Integrate GIS data • DEM concerns
The Program • Built with Visual C++ and OpenGL • Over 850 lines of code! • Functions • Navigation • Year swapping • Stand swapping • Tree selection
Image from the Forest Visualization Project: http://silvis.forest.wisc.edu/visualization/ecoFir_Spruce.asp Future Work • Improve the user interface • Process more data • Include texturing
Acknowledgments • To Eugene Zhang and Don Henshaw for their help and mentorship, • to Howard Bruner and Theresa Valentine for their help in acquiring data, • to the organizers of the EISI program, • to the National Science Foundation for their generous funding, • and to the people at HJ Andrews Experimental Forest, Thank you for this terrific summer experience!
Demo • https://netfiles.uiuc.edu/jihill/shared/EISI