Download
1 / 37
430 likes | 777 Views
Patient Safety and Quality Improvement What, Why and How Can We Teach It?. ACGME Requirements….

E N D
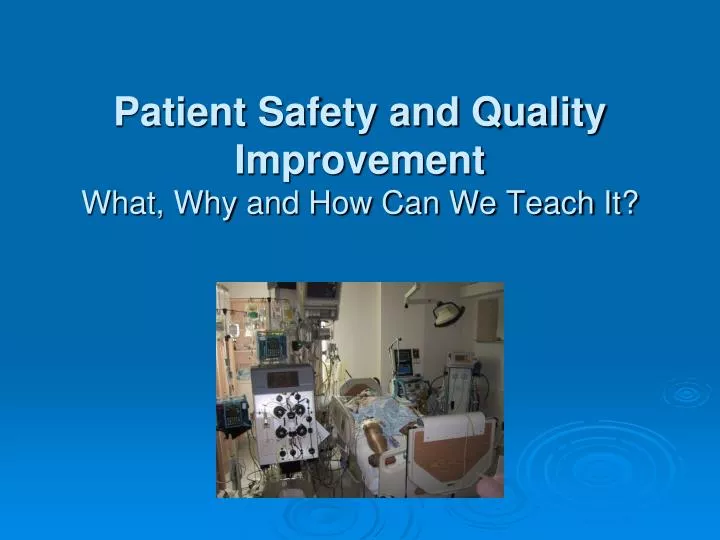
Patient Safety and Quality ImprovementWhat, Why and How Can We Teach It?
ACGME Requirements… • Practice-based Learning and Improvement: Residents must demonstrate the ability to investigate and evaluate their care of patients, to appraise and assimilate scientific evidence, and to continuously improve patient care based on constant self-evaluation and life-long learning. • identify strengths, deficiencies, and limits in one’s knowledge and expertise; • set learning and improvement goals; • identify and perform appropriate learning activities; • systematically analyze practice using quality improvement methods, and implement changes with the goal of practice improvement; • incorporate formative evaluation feedback into daily practice; • locate, appraise, and assimilate evidence from scientific studies related to their patients’ health problems; use information technology to optimize learning; • participate in the education of patients, families, students, residents and other health professionals. • Systems-based Practice: Residents must demonstrate an awareness of and responsiveness to the larger context and system of health care, as well as the ability to call effectively on other resources in the system to provide optimal health care. • work effectively in various health care delivery settings and systems relevant to their clinical specialty; • coordinate patient care within the health care system relevant to their clinical specialty; • incorporate considerations of cost awareness and risk-benefit analysis in patient and/or population-based care as appropriate; • advocate for quality patient care and optimal patient care systems; • work in interprofessional teams to enhance patient safety and improve patient care quality; ‘ • participate in identifying system errors and implementing potential systems solutions.
So far, what do we have? • Teachers • VA Chief Resident(s) for Patient Safety and Quality Improvement • Hospitalists (VA) including Assistant Chief for Patient Safety and QI • Primary Care (VA, USF and 30th St) • Simulation Center • Dr Fabri • Learners • Internal Medicine Residents- elective and ward months, outpatient block • Medical Students- 3rd year internal medicine rotation, 4th year elective, AI • Occupational Medicine Residents • VA Nursing Staff
Outline Patient Safety Principles/Activities Swiss Cheese Model Root Cause Analyses Human Factors Engineering Quality Improvement Tools Flow Chart Fishbone Plan-Do-Study-Act Quality Improvement Initiatives Examples of Plan-Do-Study-Act Cycles Conclusion Logistics Goals for the Future Resources
Highly publicized Errors in Medicine- Normal Accidents? Wachter, R. M. (2008). Understanding patient safety. New York, McGraw-Hill Medical.
Patient Safety • 1991- Harvard Medical Practice Study, NEJM • Reviewed >30,000 medical charts • Adverse event was defined as: “injury that was caused by medical management (rather than the underlying disease) and that prolonged the hospitalization, produced a disability at the time of discharge or both.” • 4% of admissions were injured • 13.6% of these adverse events led to death • >50% were preventable (although lots of disagreement on this) Brennan, T. A., L. L. Leape, et al. (1991). "Incidence of adverse events and negligence in hospitalized patients. Results of the Harvard Medical Practice Study I." N Engl J Med 324(6): 370-376. • 1999/2000- Institute of Medicine report: “To Err is Human: Building a Safer Health System” • Estimated 44,000-98,000 Americans die each year from medical mistakes • 50% of these deaths were counted as “not preventable” • Deaths due to preventable adverse events were greater than MVA, breast cancer or AIDS • Equal to a jumbo jet crashing every day Kohn, L. T., J. Corrigan, et al. (2000). To err is human : building a safer health system. Washington, D.C., National Academy Press.
Patient Safety Principles and Activities • Swiss Cheese Model • Tracers • Root Cause Analyses • Mock- RCA • Human Factors Engineering • HFE workshops
Swiss Cheese Model • Need to focus on the “root causes” not just the sharp end of the error Culture of Low Expectations No procedural IDprotocol Production Pressures Steep Authority Gradients Reason, J. T. (1990). Human error. Cambridge England ; New York, Cambridge University Press.
Activity: Tracers • Examine common hospital processes with high impact on patient safety and quality of care, identify vulnerabilities and safeguards • MRI Tracer • Pharmacy Tracer • Thoracentesis Tracer • GI consult Tracer • Identify “layers of cheese” • Identify “holes in the cheese”
How do we analyze these adverse events? • Root Cause Analyses • What happened, why did it happen, what can be done? • Triggered from actual events and close calls with “severe” potential
4 Basic Steps in an RCA • 1) Identify the Problem • 2) Event Flow Chart • 3) Cause and Effect Diagram • 4) Develop Solutions or “Actions” • Strong- architectural/physical plant changes, new devise, engineering control or interlock, remove unnecessary steps • Intermediate- increase staffing/decrease in workload, software enhancement modifications, checklists • Weak- double checks, warning and labels, new procedure memorandum, training
What is Human Factors Engineering? • Designing systems devices, software and tools to fit human capabilities and limitations • Minimize error and optimize safety • Using established methods to gather unique information about • Hidden needs of the end-user • Unexpected interactions between the system and the user • Taking advantage of knowledge bases about human system interaction
Human Factors Engineering VS. • “ At one point, the pulmonologist tried to put a mask over [Steve Jobs] face when he was deeply sedated. Jobs ripped it off and mumbled that he hated the design and refused to wear it. Though barely able to speak, he ordered them to bring five different options for the mask and he would pick a design he liked…He also hated the oxygen monitor they put on his fingers. He told them it was ugly and too complex.” • - New Yorker, Nov 14th
Activity: HFE Workshop Identify and understand how human strengths and weaknesses affect system design, interact with the environment and contribute to errors - Glucometer - Insulin Pen - Spiriva - Thoracentesis Kit - Venti-masks - Suction on code cart - Ideas? Identify weak/intermediate/strong actions Better Make sure to use the correct color Adaptor!?
Epidemiology of Quality Problems Question: “how can doctors and hospitals be practicing high quality, evidence-based medicine yet have such stunningly different approaches to the same problem?” • 1987: Wennberg et al compared New Haven and Boston university hospitals • In 1982 expenditures per head for inpatient care were $451 in New haven and $889 in Boston • Found widespread deviations from best practices Wennberg, J. E., J. L. Freeman, et al. (1987). "Are hospital services rationed in New Haven or over-utilised in Boston?" Lancet1(8543): 1185-1189. • Many studies since have demonstrated large variations in quality of care based on race, income and gender (“ healthcare disparities”) • 2003: McGlynn et al evaluated 12 metropolitan areas in the US, looked at performance on 439 indicators of quality of care for 30 acute and chronic conditions as well as preventative care • 54.9% of patients received recommended care McGlynn et al. “The Quality of Health Care Delivered to Adults in the United States.” NEJM 2003; 348: 2635-45
What is Quality? • In 2001, IOM report: Crossing the Quality Chasm defined 6 aims for a quality healthcare system • Patient safety • Patient-centeredness • Effectiveness • Efficiency • Timeliness • Equity • Quality is not just delivery of EBM, its much broader • Lean: Maximizing value-added processes, eliminating waste, from the perspective of the end user (the PATIENT) • Six Sigma: Remove defects, reduce variability
QI Tools: Process Flow Diagrams • Graphic representation of the sequence of steps in a process • Often, one member of the process is not aware of what the other members are doing • Stay as high as possible, for as long as possible (the Woodstock rule)
What is an Ishikawa Diagram Developed by Ishikawa in Kawasaki Shipyards Made famous when used in the development of the Mazda Miata AKA Fishbone diagram Brainstorming Tool Tool for uncovering and describing factors that influence an outcome 3 steps: Identify the problem - A concise problem statement - i.e. Long Wait times in Clinic 2. Create headers for the fish skeleton - Need to be mutually exclusive and comprehensive - i.e. People, Policy, Methods, Materials, Other 3. Investigate each of the headers for more concrete examples - i.e. understaffing at the pharmacy would fall under Man Power
Fishbone Example: Long Wait Times in Primary Care Clinic People Policy HIPAA limits abilities of front desk personel Nursing understaffed Each physician likes things done differently Allscripts communication rather than verbal Long wait times in walk-in clinic Redundancy- pts filling out same forms and questions multiple times Not enough exam rooms Too many steps in the process- precheckin, checkin, nursing intake etc.. Outdated new patient questionnaires Methods Materials
Examples of PDSAs…. What changes for next cycle? Can the change be implemented Set objective Ask questions Make predictions Plan how to answer Collect data ACT PLAN STUDY DO Carry out the plan Collect the data Begin analysis of the data Complete the analysis Compare data to predictions Summarize what was learned
PLAN: Project Charter Problem Statement: There are discrepancies between physician MRI screening questionnaires and MRI tech screening questionnaires Primary Metric: Mean # of discrepancies per chart Project Goals/Objectives: Reduce mean # of discrepancies per chart by 70% and increase the likelihood of a single chart making it through the process without a discrepancy Scope: Inpatients receiving MRIs Monday-Friday Team Champion: Dr. Lezama Process Owner: Dr. Joseph Parise Members: Dr. Emily Lorch, Dr. Alex Reiss (Hospitalist Chief) Carolyn Eubanks (MRI tech supervisor), Gwen Patterson (MRI tech), MRI clerk, Lynn Martinez (CPRS) What is the impact to: Customers: improved MRI safety, decreased # of redundant forms Company: improved MRI safety, improved efficiency
PLAN: Process Mapping Process Level 1 Process Level 2
PLAN: Fishbone Diagram Methods People Staffing issues- not enough techs Possible to bypass form Lack of knowledge Not windows compatible Discrepancies between MRI forms Least experienced on the team Not enough computers Redundancy Pt sedated by the time they get to MRI Too many questions Not available in paper form Limited resident hours Materials Policy
PLAN: 35% of the MRI forms had at least 1 discrepancy…. 80% of the defects are in 6 fields: welding, joint, back/joint surgery, contrast allergy, Kidney or liver disease, stents
DO: Educational Component Cochlear implant M R I Morbid obesity Aneurysm clip Renal insufficiency iNfusion pump Insane Cardiac pacemaker Eye metal Limb prosthesis C A N C E L
STUDY: Binomial Analysis • Prior to the changes 35% of charts had at least 1 discrepancy between the tech form and the MD form • Following our interventions, 3% of the charts had at least 1 discrepancy
Study: Fischer’s Exact Test and CI for Two Proportions Sample X N Sample p 1 35 100 0.350000 2 3 30 0.100000 Difference = p (1) - p (2) Estimate for difference: 0.25 95% CI for difference: (0.107649, 0.392351) Test for difference = 0 (vs not = 0): Z = 3.44 P-Value = 0.001 Fisher's exact test: P-Value = 0.011
Plan for Control Chart Week No. of Defects No. of MRIs week 1 2 100 week 2 3 83 week 3 4 90 week 4 1 101 week 5 2 80 week 6 1 90
Another Example of a PDSA: Inpatient Medicine • PLAN: Thoracentesis samples sent in wrong tube • - Trace process from inpatient medicine floors, Interventional Radiology • - Fishbone diagram- pH and CBC were primary problems (consistent with pareto’s law) • DO: Modify the Medicine Order Set • STUDY: Following the intervention review what % of thoracentesis tubes were sent incorrectly • ACT: Educate IR about our new order set • If intervention doesn’t work, how can we modify it
Another Example of a PDSA:Outpatient Medicine • PLAN: Identify a quality measure to target • i.e. documentation of goals of care, flu shots, colonoscopy screening Each resident reviews their current processes and success rate with regard to the measure • What % of patients have appropriate documentation • What are some barriers to meeting this measure • May need flow diagram, fishbone, FMEA • DO: Develop an intervention (or action)- • Resident or staff education • Make forms more available • EMR modifications • STUDY: Following the intervention review what % of patients have appropriate documentation • ACT: If intervention works, spread the word! If intervention doesn’t work, how can we modify it
Logistics • Initiative needs to come from the TOP • Need to appoint a “QI/PS” team leader • Allocate time- should start with “protected time” for both the attendings and the residents • Suggestions: • Noon-conference • Morning report • Rounds • Outpatient block • Orientation • Part didactics but mostly active learning • Evaluation and feedback are important so that it seems like a “real” part of the curriculum
Goals for the Future • Other specialties and disciplines: surgery, OB/GYN, psychiatry, dermatology, nursing etc.. • Teach the teacher- dry run of our SGIM workshop “A Toolbox for Teaching Patient Safety” • Integration into orientation for both MS III and PGY1s • Integration into basic clinical months (rather than isolated electives) • Collaboration with other departments here at USF: psychology, engineering, public health • Collaboration with other universities
Resources • Patient Safety • Wachter, R. M. (2012). Understanding patient safety. New York, McGraw Hill Medical. • Reason, J. T. (1997). Managing the risks of organizational accidents. Aldershot, Hants, England ; Brookfield, Vt., USA, Ashgate. • National Patient Safety Center: http://www.patientsafety.gov/curriculum/index.html (Dr. James Bagian) • Agency for HealthCare Research and Quality: http://webmm.ahrq.gov/ • Dr. Fabri’s Course here at USF: Patient Safety and Human Error • Quality Improvement • Nolan, K. M. and M. W. Schall (2007). Spreading improvement across your health care organization. Oak Brook, Ill. Cambridge, MA, Joint CommissionResources ; Institute for Healthcare Improvement. • Berwick, D. M., A. B. Godfrey, et al. (1990). Curing health care : new strategies for quality improvement : a report on the National Demonstration Project on Quality Improvement in Health Care. San Francisco, Jossey-Bass. • Ogrinc, G., L. A. Headrick, et al. (2004). "Teaching and assessing resident competence in practice-based learning and improvement." J Gen Intern Med19(5 Pt 2): 496-500. • American Society for Quality: http://asq.org/conferences/six-sigma/ • Dr. Fabri National Meetings SGIM- Patient Safety/QI Workshop, Precourse Orlando May 5-9th Society for Hospitalist Medicine Institute for HealthCare Improvement