Download
1 / 1
10 likes | 115 Views
Fluid Structure Interactions Research Group. Synchronised IRT and DIC capture to measure the strain rate dependency of fibre reinforced composites Duncan A. Crump 1 , Janice M. Dulieu-Barton 1 and Steve W. Boyd 1 Faculty of Engineering and the Environment, University of Southampton, UK.

E N D
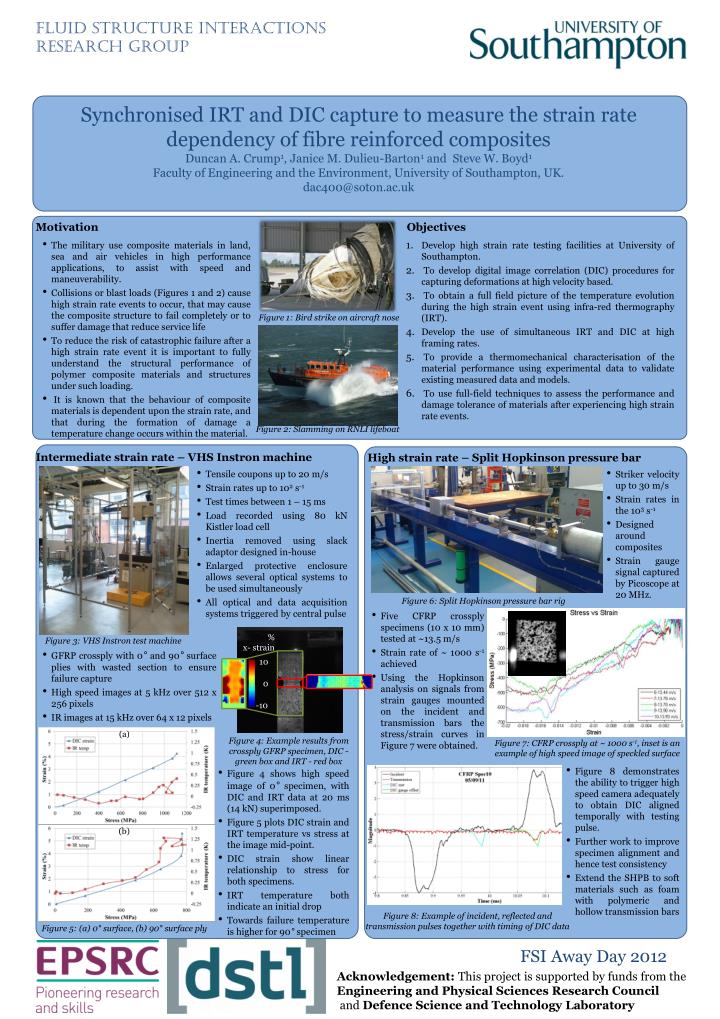
Fluid Structure Interactions Research Group Synchronised IRT and DIC capture to measure the strain rate dependency of fibre reinforced composites Duncan A. Crump1, Janice M. Dulieu-Barton1 and Steve W. Boyd1 Faculty of Engineering and the Environment, University of Southampton, UK. dac400@soton.ac.uk Motivation Objectives • The military use composite materials in land, sea and air vehicles in high performance applications, to assist with speed and maneuverability. • Collisions or blast loads (Figures 1 and 2) cause high strain rate events to occur, that may cause the composite structure to fail completely or to suffer damage that reduce service life • To reduce the risk of catastrophic failure after a high strain rate event it is important to fully understand the structural performance of polymer composite materials and structures under such loading. • It is known that the behaviour of composite materials is dependent upon the strain rate, and that during the formation of damage a temperature change occurs within the material. • Develop high strain rate testing facilities at University of Southampton. • To develop digital image correlation (DIC) procedures for capturing deformations at high velocity based. • To obtain a full field picture of the temperature evolution during the high strain event using infra-red thermography (IRT). • Develop the use of simultaneous IRT and DIC at high framing rates. • To provide a thermomechanical characterisation of the material performance using experimental data to validate existing measured data and models. • To use full-field techniques to assess the performance and damage tolerance of materials after experiencing high strain rate events. Figure 1: Bird strike on aircraft nose Figure 2: Slamming on RNLI lifeboat Intermediate strain rate – VHS Instron machine High strain rate – Split Hopkinson pressure bar • Tensile coupons up to 20 m/s • Strain rates up to 102 s-1 • Test times between 1 – 15 ms • Load recorded using 80 kN Kistler load cell • Inertia removed using slack adaptor designed in-house • Enlarged protective enclosure allows several optical systems to be used simultaneously • All optical and data acquisition systems triggered by central pulse • Striker velocity up to 30 m/s • Strain rates in the 103 s-1 • Designed around composites • Strain gauge signal captured by Picoscope at 20 MHz. Figure 6: Split Hopkinson pressure bar rig • Five CFRP crossply specimens (10 x 10 mm) tested at ~13.5 m/s • Strain rate of ~ 1000 s-1 achieved • Using the Hopkinson analysis on signals from strain gauges mounted on the incident and transmission bars the stress/strain curves in Figure 7 were obtained. % x- strain Figure 3: VHS Instron test machine • GFRP crossply with 0° and 90° surface plies with wasted section to ensure failure capture • High speed images at 5 kHz over 512 x 256 pixels • IR images at 15 kHz over 64 x 12 pixels 10 0 -10 (a) Figure 4: Example results from crossply GFRP specimen, DIC -green box and IRT - red box Figure 7: CFRP crossply at ~ 1000 s-1, inset is an example of high speed image of speckled surface • Figure 8 demonstrates the ability to trigger high speed camera adequately to obtain DIC aligned temporally with testing pulse. • Further work to improve specimen alignment and hence test consistency • Extend the SHPB to soft materials such as foam with polymeric and hollow transmission bars • Figure 4 shows high speed image of 0° specimen, with DIC and IRT data at 20 ms (14 kN) superimposed. • Figure 5 plots DIC strain and IRT temperature vs stress at the image mid-point. • DIC strain show linear relationship to stress for both specimens. • IRT temperature both indicate an initial drop • Towards failure temperature is higher for 90° specimen (b) Figure 8: Example of incident, reflected and transmission pulses together with timing of DIC data Figure 5: (a) 0° surface, (b) 90° surface ply FSI Away Day 2012 Acknowledgement: This project is supported by funds from the Engineering and Physical Sciences Research Council and Defence Science and Technology Laboratory