Download
1 / 49
500 likes | 635 Views
Iso-MATSIRO development & results. Kei YOSHIMURA IIS, Univ.of Tokyo JAPAN. H. 18 O. H. H. 16 O. H. 16 O. D. H. Outlines. Descriptions of Iso-MATSIRO EQY1 results Issues on “Plausibility” Suggestions of experiments at new sites Yakutsk/Russia (Siberia)

E N D
Iso-MATSIROdevelopment & results Kei YOSHIMURAIIS, Univ.of TokyoJAPAN H 18O H H 16O H 16O D H
Outlines • Descriptions of Iso-MATSIRO • EQY1 results • Issues on “Plausibility” • Suggestions of experiments at new sites • Yakutsk/Russia (Siberia) • Tak/Thailand (Sub-tropics & Paddy field) • (GSWP-like) Global run • Previous Studies • “Reanalyses-forced” Atmos. Isotope Circulation Model • Colored Moisture Analysis (CMA)
MATSIRO (Takata et al., 2003, GPC)(Minimal Advanced Treatments of Surface Interaction and RunOff) • SiB-type LSM • 5 soil layers (default): • Richards equation for vertical water movement • C&H for hydraulic conductivity • TOP model for base flow • Ground water table depth is considered • Snow cover and Glacier formation • 12 soil types (Cosby et al., 1984) • 13 veg. types • No Mosaic (currently)
Iso-MATSIRO • Each of water-related variables has its isotopic concentration. • Water Mass and Isotopic Mass are always balanced. • Kinetic fractionations of • Soil evap./subl. • Intercepted water evap./subl. • Transpiration • Snow sublimation are taken into account. • No soil diffusion δEc δEt δSs δEb Rs δR Rb
IsoMAT Calculation Flow • Albedo (Canopy / Snow / Ice ) • Upward Radiations • Turbulence Parameters(Bulk coefficients for bare soil / Canopy / Stomata) • Soil / Canopy / Stomatal resistance for with/without snow) • Roughness • Sensible / Latent heat fluxes with/without snow • Soil / Canopy / Stomatal Isotopic fluxes for with/without snow • Canopy water balance • Snow Area / Snow water balance (max. 3 layers) • Snow Albedo • Runoff (Saturated / Infiltration excess / Overflow / Baseflow ) • Soil water (Ice formation/melting) (5 layers) • Vegetation water (1 layer)
Kinetic Fractionation-Jouzel’s modification of C&G • Assume that C&G is applicable to any surface conditions (Canopy/Stomata/Soil, etc). Evaporation flux Rair, qairh=0~1 Isotopic flux V Diffusion Isotopic ratio of evaporation flux Equilibrium Req, qeqh=1 Ro
EQY1 Simulations • Iterate 1 year until equilibrium. • Manaus, Munich, & Tumbarumba • Forcing: REMOiso, 15min. • Parameter: • Soil type (given) • Veg. type • Manaus: Broadleaf evergreen forest • Munich: High latitude deciduous forest & Woodland • Tumb: Broadleaf deciduous forest & Woodland • LAI (given)
Times for Equilibrium • Compare 00:00, 1 Jan and 24:00, 30, Dec. • Water Threshold:10-5mm in all soil water • Isotopic Threshold: 10-5mm*SMOW in all soil water • Manaus • 2y for H2O, 4y for H218O, 5y for HDO • Munich • 4y for H2O, 8y for H218O, 10y for HDO • Tumbarumba • 3y for H2O, 3y for H218O, 5y for HDO
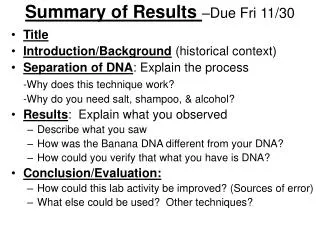
Some Results (pls see Matt’s HP) • Seasonal changes… 18O in Canopy Evap at Munich 18O in Soil Evap. at Manaus
Plausible? 2-Annual budget and seasonal variability Tumbarumba Tumbarumba δ18O in water flux (‰) Water Flux (mm/year) Manaus Manaus δ18O in water flux (‰) Water Flux (mm/year)
Plausible? 3-Diurnal Change of SWI in Veg. Manaus Tumbarumba Munich
The Questions for each ILSS from Kendal • Why the variation in amplitude of diurnal cycles in deltas? • Reservoirs: (if not reservoir size changes,) Seem to depend on degree of corresponded water fluxes. • Fluxes: ?? • What mechanisms are causing isotope variations? • 1. Isotopic Forcings (of course) • 2. Humidity variation (diurnal/seasonal) • 3. Reservoirs sizes (soil/canopy/vegetation) • 4. Latent heat partitioning (in case w/o tree?)
Suggestions for New Sites?? • Sub-Tropics, Thailand • Permafrost, Siberia
1. Tak, Thailand Tak Tower Made by Dr. Shin Miyazaki
Instruments 100m Automatic monitoring from 2002 30m RdS RdL An aRdSesT4 H lE AP U Q Ta 0m P G TG WG Made by Dr. Shin Miyazaki
View from tower (dry and rainy seasons) Made by Dr. Shin Miyazaki
MATSIRO Performance at tropical monsoon climate in Tak, Thailand By Shin Miyazaki (IIS, U-Tokyo), Wonsik Kim (NIAES), and Kei Yoshimura (IIS, U-Tokyo)
Soil moisture up-most (IGBP) Red:observation,black:simulation Rainy season Dry season-2 Dry season-1 • Dry: Obs≒ sim, Rainy: Obs>>sim Made by Dr. Shin Miyazaki
Latent heat flux (IGBP) Red:observation,black:simulation • Dry: sim≒obs,Rainy:sim≒obs Made by Dr. Shin Miyazaki
Yakutsk 2. Yakutsk, RussiaSpasskaya Pad Experimental forest of IBPC: GAME/Siberia field observation site • Great forest with little precip.(=200mm/y) • Lena river basin • Permafrost Made by Dr. Atsuko Sugimoto
18O(‰) d excess (‰) Precip 18O in Yakutsk • Summer 18O - high d value - low • Winter 18O - low d value - high Made by Dr. Atsuko Sugimoto
JJA prec (mm) 46 177 81 Different precip.amt. From year to year 1998 DRY!! 1999 WET!! 2000 Made by Dr. Atsuko Sugimoto
Soil water+Ice (g/cm3) frozen Ice lenz 0.4 0.8 Soil water 18O Soil water storage function for coming years Wet Dry Summer Upward water flux • Melted ice was used for transpiration. Wet Summer Downward water flux • Water remained after transpiration Pass winter as ice. Dry Stabilize transpiration Made by Dr. Atsuko Sugimoto
2001 Soil water storage 1998 2001 JJA prec (mm) 46 1998 1999 Water equivalent (mm) Large Inter-annual variation 1999 177 2000 2000 81 P=E+R+Q Innegligible!!! (Sugimoto et al., 2003) Made by Dr. Atsuko Sugimoto
Outlines • Descriptions of Iso-MATSIRO • EQY1 results • Issues on “Plausibility” • Suggestions of experiments at new sites • Yakutsk/Russia (Siberia) • Tak/Thailand (Sub-tropics & Paddy field) • (GSWP-like) Global run • Previous Studies • “Reanalyses-forced” Atmos. Isotope Circulation Model • Colored Moisture Analysis (CMA)
Isotopically A-L Coupled Global Simulation (still offline) Calculation flow for Each Time step GAME-Rean. Upper Meteor.Qu, Qv, W, P, E Surface Meteor.U, V, q, T, p, P ICM Iso-MAT Isotopes in vapor/precip. Isotopes in Evap.
δ18O Distribution, Apr-Oct, 98 Surface Soil Water Total Runoff Precipitation Total Evaporation
Validation in Chiangmai, 99E:18N (Precip.δ18O) Prcp. δ18O(‰)
Global Validation (Prcp.δ18O) Simulated δ18O (‰) Honestly, this is NOT evidence of land impact on atm is large. It tells reasonable range of vapor isotopes are supplied. GNIP δ18O (‰)
River discharge isotope estimates with iso-TRIP δsr1 δsr2 δsr3 O2 O1 O3 SR δsr Original TRIP:Oki and Sud (1998) R v δr O Observations
Isotopic variation at the estuary of Chaophraya • Runoff from Iso-Bucket is always through soil buffer, whereas iso-MAT runoff is mainly precip.-direct. Too large fluctuation δ18O(‰) Obs. range
Outlines • Descriptions of Iso-MATSIRO • EQY1 results • Issues on “Plausibility” • Suggestions of experiments at new sites • Yakutsk/Russia (Siberia) • Tak/Thailand (Sub-tropics & Paddy field) • (GSWP-like) Global run • Previous Studies • “Reanalyses-forced” Atmos. Isotope Circulation Model • Colored Moisture Analysis (CMA)
(Atmospheric) Isotope (18O) Circulation ModelYoshimura et al. 2003, 2004, JGR “Reanalyses-forced” offline atmospheric model.
Reproduced Daily δ18O Variations well GAME+GPCP GAMEonly Yoshimura et al., 2003, JGR
Global Distribution of δ18O is reproduced, too. Corr.coef. b/w monthly obs’d&est’d prcp iso. for 1979-93. (blue is good) Int-ann. variations of prcp iso. Yoshimura et al., 2004, JGR
1.25˚x1.25˚ W Indian Ocean QVout Pacific Ocean QUin QUout IndochinaPen. QVin BengalGulf P E “Tag” spatial attribution onto evaporated waterSea:60,Land:20 2D grid-plume model (vertical one layer) Fully mix in a timestep (10 min.)Variables (Q, W, P, E) are externally given. Contents of water on todayare analyzed Colored Moisture Analysis
Continental cycling Ratio Yoshimura et al.,2004, JMSJ
Chiangmai, Apr.-Oct. 1998 Contents of each origin in water vapor (precipitable water)
Bangkok, Apr.-Oct. 1998 Contents of each origin in water vapor (precipitable water)
Thanks for your attention! • Yoshimura, K., T. Oki, and K. Ichiyanagi, Evaluation of two-dimensional atmospheric water circulation fields in reanalyses by using precipitation isotopes databases, J. Geophys. Res., 109, doi:10.1029/2004JD004764, 2004. • Yoshimura, K., T. Oki, N. Ohte, and S. Kanae, Colored moisture analysis estimates of variations in 1998 Asian monsoon water sources, J. Meteor. Soc. Japan, 82, 1315-1329, 2004. • Yoshimura, K., T. Oki, N. Ohte, and S. Kanae, A quantitative analysis of short-term 18O variability with a Rayleigh-type isotope circulation model. J. Geophys. Res., 108(D20), 4647, doi:10.1029/2003JD003477, 2003. • E-mail: kei@iis.u-tokyo.ac.jp • Happy to have good cooperation with you
Sensitivity test - # of layers δ18O in soil water (‰) Depth (cm) 58 layers2m4m depth
Water/Isotopes Partitioningat 100E17N mm/year δ18O in water (‰)
However, Systematic underestimation. • Possibly due to land originated water?? Bar: Obs. Line: Sim. 1998 Underestimation becomes larger CMA results Land originated water becomes more Yoshimura 2004, JMSJ
Global d-excess (δD-8*δ18O) estimation • Comparison with GNIP Systematic bias
δ18O, δD, d-excess in Chiangmai δ18O d-excess δD