Download
1 / 51
510 likes | 647 Views
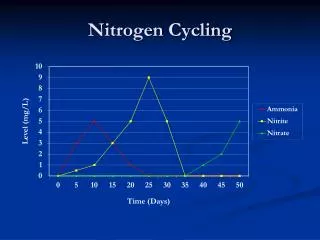
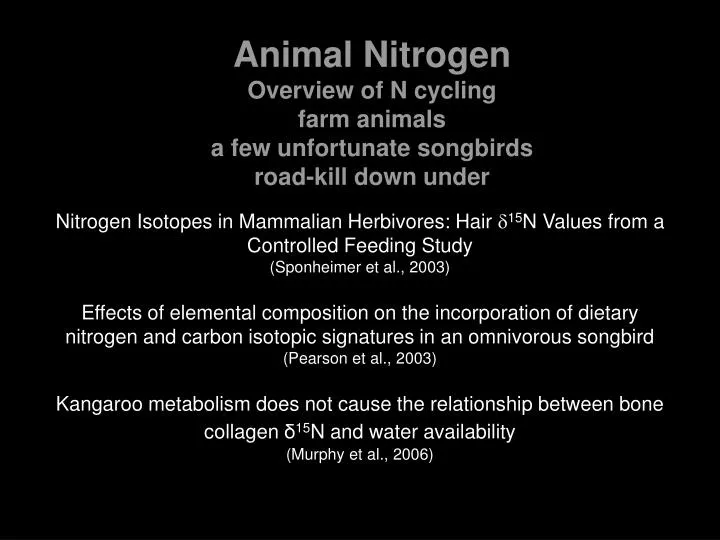
Animal Nitrogen Overview of N cycling farm animals a few unfortunate songbirds road-kill down under. Nitrogen Isotopes in Mammalian Herbivores: Hair 15 N Values from a Controlled Feeding Study (Sponheimer et al., 2003)

E N D
Animal Nitrogen Overview of N cycling farm animals a few unfortunate songbirds road-killdown under Nitrogen Isotopes in Mammalian Herbivores: Hair 15N Values from a Controlled Feeding Study (Sponheimer et al., 2003) Effects of elemental composition on the incorporation of dietary nitrogen and carbon isotopic signatures in an omnivorous songbird (Pearson et al., 2003) Kangaroo metabolism does not cause the relationship between bone collagen δ15N and water availability (Murphy et al., 2006)
N Cycle(human) • protein turnover • Some proteins turnover faster than others • some tagged (oxidized or other means) • amino acid pool • throughout body • significant mixing
N Cycle(human) • Dietary protein • Low • deficiency of essential aa’s • High • conversion to fat/glucose • Ammonia/urea excretion
Deamination First transfer amine group to carrier Ketoglutarate → Glutamate in liver or kidney Then deaminate Glutamate to produce ammonia
Synthesis First transfer amine group to carrier Ketoglutarate → Glutamate Then to amino acid in liver or kidney
Deamination Synthesis • *Direction of these reactions controlled by [ ] of • Glutamate • Ketoglutarate • Ammonia • ratio of oxidized to reduced enzymes
liver kidney Urea cycle Urea cycle controlled by acetyl CoA and glutamate increase in [ ] after protein rich meal
Nitrogen excretion animals • Ammonia NH3 • Simplest form, but toxic • fully aquatic animals • Urea (NH2)2CO • Still toxic more complex than ammonia • mammals some herps (frogs), cartilaginous fish • Uric Acid C5H4N4O3 • Least toxic • egg layers (bird, reptiles, insects) • precipitates from egg
A few things • animals assimilate dietary components with varying efficiencies • animal tissues fractionate the isotopes in their diet • animals allocate nutrients in their diet differentially to specific tissues ‘isotopic routing’ • animals retain δ15N, excreting δ14N (~6‰) • protein balance is a key to fractionation low dietary protein = “protein sparing” reserve dietary protein for tissue maintenance rather than catabolizing it for energy (Castellini and Rea 1992). high dietary protein = use diet protein for tissue synthesis and catabolize excess
Nitrogen Isotopes in Mammalian Herbivores: Hair 15N Values from a Controlled Feeding Study(Sponheimer et al., 2003) Goals: Determine the importance of • hindgut vs foregut fermentors • dietary protein levels on herbivore δ15N values.
Nitrogen uptake herbivores • Hindgut • Horses, rabbits, birds, iguanas, green turtle • Limited cycling of urea nitrogen • fermentation, N cycling, protein balance • Foregut • Ruminants (can synthesize proteins from inorganic nitrogen compounds) • multi compartmental stomachs • cows, llamas • Ruminant-like • kangaroos, wallabies, hoatzin • cycle/mix N from diet and self • deamination and de novo protein syntheses
Diet-Hair Fractionation Same diet, fair bit of variation rabbits and alpaca vary 3.6‰, > 1 trophic level! Foregut fermenters are enriched vs hindgut fermenting rabbits But not to horses…
High Protein vs Low Protein Herbivores • ↑ dietary protein (9-19%) • causes enrichment δ15N (1.5-2.8‰) • Not what they expected! • This refutes N cycling hypo • (states that low protein group ↑δ15N) • feces explanation poor • feces is δ15N enriched(0.5-3.0‰), low protein = less urine loss and greater relative (not absolute) %N loss via feces, ↑δ15N loss
Effects of elemental composition on the incorporation of dietary nitrogen and carbon isotopic signatures in an omnivorous songbird. (Pearson et al., 2003) • Goals • Determine turnover rates of δ15N and • δ13C in whole blood and plasma. • δ15N and δ13C diet-tissue fractionation factors for plasma, whole blood, and feathers. • Influence of high protein (%N) and low protein (%C) concentrations on fractionation factors. yellow-rumped warbler
Materials and methods • 32 captive wild-caught migratory birds • ‘controlled’ for age & sex • Acclimation diet 32% insect • Experimental diet • 20%,49%,73%, 97% insects • Sampled • 21 days, mass, blood (plasma, wb), feathers (entire) • Determined • C&N δvalues of different diets • turnover rates • Discrimination • Isotopic signatures of diet on different tissues
Diets: %Insect, Isotopes, & Concentrations Attempted to created diets along a linear continuum of increasing a) isotopic signature (didn’t quite work for 15N) b) elemental concentration by increasing the % insect protein in diet
Diets: %Insect, Isotopes, & Concentrations Only 0.12‰ difference in δ15N values among diets. Diet containing most insects did not have highest δ15Nvalue (diet with lowest proportion of insects did not have the lowest δ15N value) Banana Effect (δ15N0.5 - 5.3‰)
Turnover Rates Isotope incorporation kinetics model (O’Brien et. Al 2000) Δdt = discrimination factor r = fractional turnover rate Half-life =
Turnover Rates: Half-life Plasma & Blood Half-life estimates plasma: δ13C 0.4-0.7 days δ15N: 0.5-1.7 days Half-life whole blood: δ13C~4-6 days (diet 1=33 days!) δ15N 7.45-27.7 days Whole blood is variable!
Discrimination:Plasma, Feather, and Blood 15N values plasma & whole blood enriched 1.7 to 3.0‰ “Apparent” fractionation factor for feathers 15Nenriched (3.2-3.6‰) Fractionation factors increased linearly with elemental concentration in diet for N
in ↑ %N ↑ tissue δ15N out ↑ urine w/ ↑14N
Importance of Elemental Concentrations Both isotopic signature of diet and fractionation factors influence the ultimate isotopic signature of tissues (at least plasma). Supports the importance of using concentration-dependent mixing models when reconstructing diet.
Results • Discrimination factors depend on diet and tissue • Fractionation factors to reconstruct diet requires an estimate of elemental concentrations in the diet. • Turnover rates • Plasma 1 day (short) Whole blood 1 wk (longer) • Carbon and nitrogen fractionation factors increase linearly with elemental concentration in the diet. • Relationship between the isotopic signature of the diet and the sum of a given tissue’s (at least plasma) isotopic signature + fractionation factor was also positive & linear. • USE CONCENTRATION-DEPENDENT MIXING MODELS WHEN ATTEMPTING TO ESTIMATE THE RELATIVE CONTRIBUTION OF DIFFERENT FOOD SOURCES TO AN ANIMAL’S DIET!!!
Kangaroo metabolism does not cause the relationship between bone collagen δ15N and water availability(Murphy & Bowman, 2006) Goals • Evaluate importance of water availability and dietary δ15N in determining δ15N values in herbivore bone collagen • Indirectly determine if ↑ δ15N linked to animal metabolism • Assessed if δ15N in grass and Kangaroo bone collagen are constant with respect to a Water Availability Index • Examine other factors influencing δ15N in herbivore bone collagen
Does ↓ Water availability↑δ15N in Animal Tissue? Plants enriched in arid environs • ‘openness’ N cycle theory (Austin & Vitousek 1998) • ↑ water in system = ↓ in ratio of N loss to intrasystem N turnover • Cryptobiotic crusts Why ↑ animal δ15N when in water limited systems? • Metabolic enrichment ‘theories’ • ↑ Urea osmolarity, urine excreted is more nitrogen (δ15N) concentrated (Ambrose & Deniro 1986, Sealy 1987) • excrete more δ15N deplete urea when arid (Sponheimer 2003) • not experimentally shown for rats (Ambrose 2000) • not tested rigorously… BUT… can ↑ δ15N be explained by herbivore diet alone?
Methods • 173 grass collections (3-4 primary spp/collection) • 779 road killed roos • macropus sp, grazers… • Water Availability Index estimated from mean annual actual and potential evapotranspiration • Akaike’s Information Criterion (AIC) Big study!
+ →
= data +
Results • Found relationship of δ15N and WAI similar between grass and kangaroo bone collagen • 4.74‰ to 4.79 ‰ enrichment • ~0.05‰ variation over entire range of data
When plotted against annual rainfall Murphy & Bowman’s δ15N relationship fits with • Previous Kangaroo work • Eutherian herbivores • North America & Africa • matches • Sealey et al 1987 follows similar pattern
δ13C of bone collagen as proxy • negative and weak relationship • Found lower δ15N in C4 plants (1.1‰) • C4 diet (high δ13C, low protein) = lower consumer δ15N What about C3 vs C4 grasses? C4 C3 C3 • Model gave little support for other variables: • slope • chenopod C4
Summary • Strong negative relationship of herbivore δ15N bone collagen and water availability. • Near identical negative pattern of δ15N in grass and kangaroo bone collagen with water availability (near constant offset in slopes) • Suggest dietary δ15N is main cause of negative relationship between δ15N of kangaroo bone collagen, with water availability and metabolic factors having little discernible effect.
Importance… • Ties water availability directly to plant δ15N to animal δ15N values, with little ‘animal’ affect • Huge support for historic trophic ecology and past climate change data that rely on direct relationship between herbivores and plants which not confounded by animal metabolism
Marine food webs are enriched in δ15N (Kelly 2000)
Trophic Systems Marine systems 3-4‰/trophic level Herbivores ~3.2‰ Carnivores 5‰ (Hobson & Welch 1992)
Trophic Systems • Marine food chains tend to have longer food webs • Diet affects, as ascend trophic chain, ↑ %N in diet expect more catabolism = discrimination @ high trophic level • Trophic enrichment commonly produces 3:1 slope for δ15N and δ13C ratios
Diet-Hair d15N Equilibration Hair Dietary 15N values changed from 2.5‰ to 7.8‰. Dietary equilibration took ~8-10 weeks
δ15N in top consumers in C3, C4 and Marine food chains (Kelly 2000)
Discrimination • Tissue effects Feathers more enriched than plasma or wb
Diet Tissue Relationship • C & N signatures linearly related with tissue signatures + discrimination factors
Turnover Rates • Correlated linearly with metabolic rate of tissue • Different species have different turnover rates for same tissues Likely related to size, mass specific metabolic rates, life history factors half-life for wb C in bear > crow > quail > warbler
Turnover Rates • Plasma (1-5 days) • Whole Blood (5-35 days) • Feces ( • Feathers, Hair, Nails, Hoof (time when grown, maybe a lag here) • Bone • Teeth
Importance of Elemental Concentrations Phillips & Koch 2002
Implications WUE NPP N demand CO2 ‘openness’ of N cycle δ15N in plants δ15N in herbivores
Pearson • Funk/questions • variability in initial mass and mass change following dietary switch among treatment groups (shows they like carbs • Diets did not have ↑ δ15N values w/ ↑ % insects • Fractionation vs. discrimination