Download

1 / 91
910 likes | 914 Views
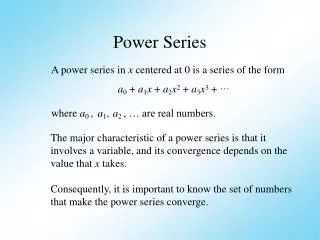
Fluke 430 Series Power Quality Analyzer. Understanding the product and its application. Why do we need the 430 ?. Reasons for PQ Problems. Past - loads were “linear” Induction-motors, heating, bulbs voltage has been directly followed by current - only a few problems

E N D
Fluke 430 Series Power Quality Analyzer Understanding the product and its application
Reasons for PQ Problems • Past - loads were “linear” • Induction-motors, heating, bulbs • voltage has been directly followed by current - only a few problems • Present – loads are mostly “not linear” • Computers, motor-control, Halogen Lighting etc. • Current is pulse shaped, the result: Harmonics • Increasing creators of disturbances • Equipment has become more sensitive • Cost cutting within the de-regulated energy market
Symptoms - Computers • System lock-up • System crash • Data loss and errors • Component damage • Monitor noise or wavy screen
Symptoms - Process Control • System shutdown • Circuit breaker nuisance tripping • Nuisance tripping GFRs (Ground Fault Receptacle) • Failure to operate • Misoperation of equipment
Symptoms – Motors & Drives • Overheating • Contact damage • Insulation damage • Nuisance tripping ASDs
Symptoms - Lighting • HID (high intensity discharge) lights turn off • “Burn-out” (filament failure) • Lower light output • Flickering lights
Symptoms - Installation • Overheated distribution neutrals • Overheated transformers • Voltage distortion causing timing errors • Nuisance tripping GFRs • Process control errors • Unwanted distortion, Low Power Factor
Typical Power Problems • Voltage dips/sags and outages • Over current (tripping CB’s) • Utility Bills • Energy consumption • Peak Demand • Power Factor Penalties • Voltage swells • Transients • Voltage unbalance • Excessive harmonics • Flicker • Noise • Ground currents or poor grounding
Turn-Key Solution I400S: 400 Amp AC clamp
The Front Panel - Simple Function Keys Arrows • Main Functions • Scope • Menu • Monitor Setup Memory Save screen Backlight On/Off Enter Pressing Enter for 5 sec will lock the keyboard. Repeating this will unlock it.
Software UI - Simple • Starting from a familiar style • Into a Fluke 430 Series
Basic instrument set-up On/Off
The main set-up screen • User name – editable in user preference • Real time clock/calendar • Wiring Configuration • Color codes • Freq & Nominal voltage • Limit setting: EN50160 default • Probes and scaling
Wiring configurations 3 phase WYE and DELTA systems are the most common configurations.
Fluke 430 inputs Stickers are supplied to change color coding
Setting Color Codes • The 430 contains a set of color coding rings that make leads and clamps correspond to local wiring standards. These rings should be applied to voltage and current probes. • In the SETUP screen, you should also set the screen colors to correspond to local standards.
Color Codes • Varies by country and territory. • Not always done correctly. • Bus bar usually not labeled. • Australia & New Zealand: • Red / White / Blue / Black / Yellow Green Strip • USA: • Black / Red /Blue / White / Green • Europe: • Red / Yellow / Blue / Black / Yellow Green strip
Input Section • Voltage inputs • Range is fixed. • Not allowed to range since gaplessnon overlapping measurements must be made • 6kV range used for transient mode only (12kVpkpk, 1000Vrms) No BW limiter • 1000V, 500V, 250V range selected as 2x Vnom (IEC 61000-4-30 requires 2x over ranging) BW limiter required to prevent aliasing (IEC 61000-4-7) • Demo mode low voltage input, not accurate, mV is scaled to Vnom • Measurements are referenced to Ground. Software calculates Phase to Neutral of Phase to Phase voltage. • Ground is not required for safety
Input Section • Amps inputs • Fixed Hardware range 0….3VDepending on clamp scaling mV are displayed as Amps • Common of clamps is connected to Ground connection
Understanding the Display Latest reading or reading at the cursor • Unstable reading indicator if reference phase is lost • IEC-61000-4-30 “Flag” • Recording Run/Hold Indicator • Power Source Indicator • Zoom Factor • Keyboard locked Elapsed recording time Cursor Date and Time of Day Setup Parameter Selector
The Main functions: Scope • Main Functions • Scope
Scope Function • Application: Use the Scope function to verify correct connections • For a three-phase system, you should see something like the two screens show here. • Use F3 to toggle between scope and phasor display • F1 allows you to view individual parameters (V, A) or individual phase (L1, L2, L3, N) • The scope display is optimized for use on power systems and does not provide attenuators, time base, or trigger settings like the scope on the Fluke 43B.
The Main functions: Menu • Main Functions • Menu
MenuVolts / Amps / Hertz Application: check basic system parameters quickly. Are voltage and current within expected range
AutoTrend: every reading is always recorded Elapsed time The trend builds in the background, as soon as you select a function from the menu. The “tape” icon shows when you’re recording AutoTrend also with Dips & swells, Harmonics, flicker power and energy measurements
Every reading is automatically recorded:All 3 phases and Neutral 7 different displays with 25 trend graphs in V/A/Hz mode
Want more detail?Use “Vertical ZOOM” to view individual Graphs Focus at a single trace at a time Full screen display Min Max Avg readings
Want more detail?Use “Vertical ZOOM” to view individual Graphs Want to see the other graphs as well? …..25 Individual graphs
Want more detail?Use “Horizontal ZOOM” to view more or less time Up to 6 x ZOOM 1800 min/max/avg data points per trend
Use cursors to Analyze Waveform select + Vertical Zoom Waveform select Cursor remains at same time across all screens to determine timing relations be different parameters
Cursors and ZOOM; Summary • Horizontal zoom: • lets you look at more or less time • Vertical zoom • lets you focus on one trace at a time • Cursors turned off • the readings at the top of the display are the latest readings • Cursors turned on • the cursor gives rms reading for all trends at that time • and vertical zoom readings are min/max/and avg for the single trend at that time
Timed start/stop of Trend graph By pressing HOLD/RUN in the trend screen, you can program the trend recording to start at a later date and time.
What’s a Dip (sag), swell or interruption? Dip Interruption Swell • Dips, swell and interruptions are characterized by duration, magnitude and time of occurrence • Starts when from one of the phases the voltage goes below/above the threshold • Stops when all phases are above/below the threshold + hysteresis. • Levels and duration are specified by EN 50160
Setup Dip, Swells and Interuptions Default setup are EN50160 values. Normally no need to change. Set is done via the EN50160 setup from the main Setup menu. See EN50160 table for details
Rapid Voltage change A quick change of the RMS voltage between two steady voltages.
Dips & Swells Voltage and Current trend graphs are recorded simultaneously By trend the cursor will highlight the specific event
Explaining HarmonicsWhat is it? • Energy applied to frequencies other than the fundamental. • Can cause overheating in neutrals & early transformer failure. • Result of electronic power supplies, non-linear loads (halogen lamps), motor drives etc • Problems may be addressed by applying filters or de-rating transformers.
Explaining HarmonicsDistorted Waveforms Harmonic frequencies combine with the fundamental sinewave to form non-sinusoidal (distorted) waveforms. a) A sine wave of current at the fundamental frequency b) A sine wave of current at the 3rd harmonic c) The combination of (a) and (b) resulting in a distorted waveshape
Explaining HarmonicsWhat Causes Distortion? • Waveform distortion is caused by non-linear loads, which includes virtually all electronic loads: • DC power supplies (PC, office equipment) • Light switch dimmers and electronic ballast • Variable speed drives The diode -capacitor input circuit draws short pulses of line current during the peak of the line voltage.
ØA ØB ØC Explaining Harmonics3rd Harmonic • On a 3-phase/4-wire system, triple (zero sequence) harmonics will add up in the neutral feeder. • 3rd harmonic in each feeder is in phase. There is no vector cancellation as there is with the fundamental currents (which are 120° out of phase).
IEC 61000 Harmonics Measurements • Harmonics measurements comply with IEC 61000-4-7 • Signals up to 9kHz • Measurement period consecutive 10/12 cycles (50/60Hz) with no overlap. Harmonic measurement Inter-harmonic Measurement
Measuring harmonics with the Fluke 430Harmonics & Spectrum Analysis The spectrum shows how much of each harmonic frequency is present in a waveform • The Fluke 430 can display the spectrum for • Voltage • Current • Power • Display as a bar chart or as a table • Up to 50th Harmonic • Measure Harmonic as %R (total Harmonic Voltage) or %F (fundamental voltage)
Reactive power (kVAr) Apparent power incl harmonics (kVA) True Power (W) Reactive power (Harmonic component) Cos φ (dpf) : true power/Reactive power (fundamental) PF: true power/reactive power (incl harmonics) Explaining power What is it? • Ideal load has unity power factor. • Thing of the past! • Power factor effects the efficiency of consumption. • Cause is related to the type of loads and level of harmonics. • Common mitigation is the use of capacitors. • Some suppliers will charge penalties.
Power & Energy • Measures • Real power (kW) • Apparent power (kVA) • Reactive power (kVAR) • Indicates inductive (lagging) or capacitive (leading) power factor • Autotrend every reading. • 7 measurements for 3 phases + neutral • Use Cursor and zoom