Download
1 / 22
220 likes | 352 Views
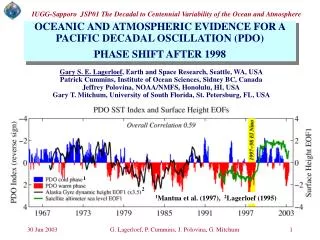
Oceanic Response to Idealized Freshwater Flux in the Pacific at Decadal Timescale Boyin Huang ( 1 ), Vikram M. Mehta ( 1 ), and Niklas Schneider ( 2 ) (Journal of Physical Oceanography, 2005, in press) (1) The Center for Research on the Changing Earth System

E N D
Oceanic Response to Idealized Freshwater Flux in • the Pacific at Decadal Timescale • Boyin Huang (1), Vikram M. Mehta (1), and Niklas Schneider (2) • (Journal of Physical Oceanography, 2005, in press) • (1) The Center for Research on the Changing Earth System • (2) University of Hawaii • 1. Introduction • 2. Model description • 3. Oceanic respons • 4. Mechanism diagnosis • 5. Summary • Supported by NASA-Ocean Physics Grants NAG5-11785 and NAG5-12729
Introduction Important fluxes affecting the oceans: (1) wind stress (2) surface heat flux (3) freshwater flux (E-P-R) What are the responses of the oceans to E-P-R? What are the timescales and magnitudes of the responses?
The MIT OGCM Domain: Global ocean from 80ºS to 89ºN Realistic topography Resolution: 2º in longitude, 0.4-2º in latitude 10-500m in depth Subgrid-scale parameterizations: Vertical mixing and viscosity: KPP Horizontal mixing: 10³ m²/s Forcing: Monthly E-P (1988-2000) COADS heat flux, Levitus SST Hellerman wind stress
Freshwater data: SSM/I evaporation, GPCP precipitation, runoff of 921 rivers SBC during spinup (200 yr) and control (CTR) experiment: SBC during perturbation (PTB) experiments:
Experiments Four experiments of 20 years long: 1. EP, 100 cm/yr anomalous freshwater for 5 years 2. NP, -100 cm/yr anomalous freshwater for 5 years 3. SP, -100 cm/yr anomalous freshwater for 5 years 4. EP + NP + SP.
Separation of Salinity (Temperature) Anomaly: Local change: Advection: Vertical mixing:
Goldsbrough-Stommel Circulation Potential vorticity conservation:
Summary • S anomalies were directly associated with the E-P anomalies via • vertical mixing, and T anomalies were largely associated with • anomalous ocean advection that is driven by large-scale E-P • forcing. • Changes in ocean circulations were consistent with the • Goldsbrough-Stommel theory. • S and T anomalies can propagate between tropics and subtropics • due to Ekman flow, western boundary current, gyre circulation, • and waves. • T response is slower due to basin-scale circulation adjustments, • indicating a possible impact of freshwater on ocean variability at • decadal timescale. • T changes in the subsurface ocean were not very sensitive to the • atmospheric damping.
ATMOSPHERE P E OCEAN CIRCULATION OCEAN Temperature OCEAN Salinity