Download
1 / 8
80 likes | 173 Views
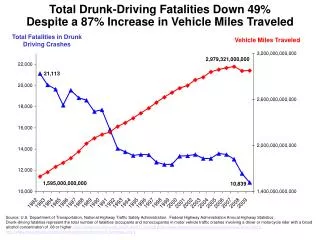
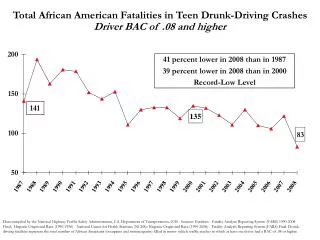
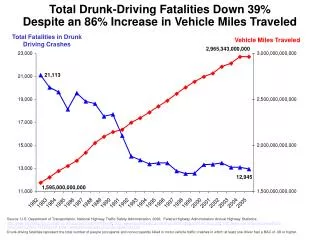
Total Drunk-Driving Fatalities Down 38% Despite a 90% Increase in Vehicle Miles Traveled. Total Fatalities in Drunk Driving Crashes. Vehicle Miles Traveled.

E N D
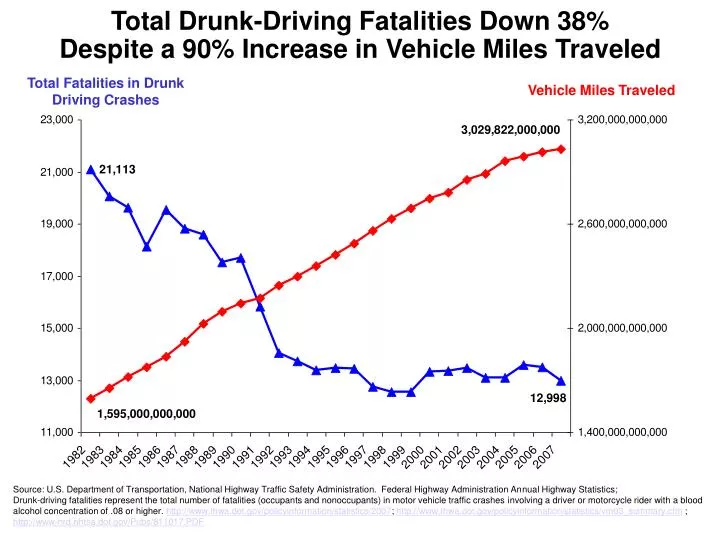
Total Drunk-Driving Fatalities Down 38% Despite a 90% Increase in Vehicle Miles Traveled Total Fatalities in Drunk Driving Crashes Vehicle Miles Traveled Source: U.S. Department of Transportation, National Highway Traffic Safety Administration. Federal Highway Administration Annual Highway Statistics; Drunk-driving fatalities represent the total number of fatalities (occupants and nonoccupants) in motor vehicle traffic crashes involving a driver or motorcycle rider with a blood alcohol concentration of .08 or higher. http://www.fhwa.dot.gov/policyinformation/statistics/2007; http://www.fhwa.dot.gov/policyinformation/statistics/vm03_summary.cfm ; http://www-nrd.nhtsa.dot.gov/Pubs/811017.PDF
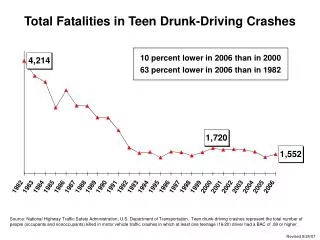
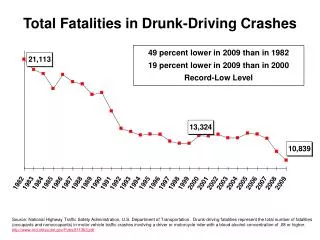
Total Drunk-Driving Fatalities Per Billion Vehicle Miles Traveled 12 percent lower in 2007 than in 2000 68 percent lower in 2007 than in 1982 Record-Low Level Source: U.S. Department of Transportation, National Highway Traffic Safety Administration. Federal Highway Administration Annual Highway Statistics; Drunk-driving fatalities represent the total number of fatalities (occupants and nonoccupants) in motor vehicle traffic crashes involving a driver or motorcycle rider with a blood alcohol concentration of .08 or higher. http://www.fhwa.dot.gov/policyinformation/statistics/2007; http://www.fhwa.dot.gov/policyinformation/statistics/vm03_summary.cfm ; http://www-nrd.nhtsa.dot.gov/Pubs/811017.PDF
Total Drunk-Driving Fatalities Down 38% Despite a 64% Increase in Registered Motor Vehicles Registered Motor Vehicles Total Fatalities in Drunk Driving Crashes Source: U.S. Department of Transportation, National Highway Traffic Safety Administration. Federal Highway Administration Annual Highway Statistics; Drunk-driving fatalities represent the total number of fatalities (occupants and nonoccupants) in motor vehicle traffic crashes involving a driver or motorcycle rider with a blood alcohol concentration of .08 or higher. http://www.fhwa.dot.gov/policyinformation/statistics/2007 ; http://www.fhwa.dot.gov/policyinformation/statistics/2007/mv1.cfm ; http://www-nrd.nhtsa.dot.gov/Pubs/811017.PDF
Total Drunk-Driving Fatalities Per Million Registered Motor Vehicles 62 percent decline since 1982 Record-Low Level Source: U.S. Department of Transportation, National Highway Traffic Safety Administration. Federal Highway Administration Annual Highway Statistics; Drunk-driving fatalities represent the total number of fatalities (occupants and nonoccupants) in motor vehicle traffic crashes involving a driver or motorcycle rider with a blood alcohol concentration of .08 or higher. http://www.fhwa.dot.gov/policyinformation/statistics/2007 ; http://www.fhwa.dot.gov/policyinformation/statistics/2007/mv1.cfm ; http://www-nrd.nhtsa.dot.gov/Pubs/811017.PDF
Total Drunk-Driving Fatalities Down 38% Despite a 37% Increase in Licensed Drivers Total Fatalities in Drunk Driving Crashes Licensed Drivers Source: U.S. Department of Transportation, National Highway Traffic Safety Administration; Federal Highway Administration, U.S. Department of Transportation; Drunk-driving fatalities represent the total number of fatalities (occupants and nonoccupants) in motor vehicle traffic crashes involving a driver or motorcycle rider with a blood alcohol concentration of .08 or higher. http://www.fhwa.dot.gov/policyinformation/statistics/2007 ; http://www.fhwa.dot.gov/policyinformation/statistics/2007/dl1c.cfm ; http://www-nrd.nhtsa.dot.gov/Pubs/811017.PDF
Total Drunk-Driving Fatalities Per Million Licensed Drivers 55 percent decline since 1982 Record-Low Level Source: U.S. Department of Transportation, National Highway Traffic Safety Administration; Federal Highway Administration, U.S. Department of Transportation; Drunk-driving fatalities represent the total number of fatalities (occupants and nonoccupants) in motor vehicle traffic crashes involving a driver or motorcycle rider with a blood alcohol concentration of .08 or higher. http://www.fhwa.dot.gov/policyinformation/statistics/2007 ;http://www.fhwa.dot.gov/policyinformation/statistics/2007/dl1c.cfm ; http://www.fhwa.dot.gov/policy/ohpi/hss/hsspubs.htm; http://www-nrd.nhtsa.dot.gov/Pubs/811017.PDF
Total Drunk-Driving Fatalities Down 38% Despite a 31% Increase in Total U.S. Population Total Fatalities in Drunk Driving Crashes Total U.S. Population Source: U.S. Department of Transportation, National Highway Traffic Safety Administration; Drunk-driving fatalities represent the total number of fatalities (occupants and nonoccupants) in motor vehicle traffic crashes involving a driver or motorcycle rider with a blood alcohol concentration of .08 or higher. http://www-nrd.nhtsa.dot.gov/Pubs/811017.PDF Source: U.S. Census Bureau, Intercensal population estimates 1980-1989 http://www.census.gov/popest/archives/1980s/st8090ts.txt; 1990-1999, http://www.census.gov/popest/archives/2000s/vintage_2001/CO-EST2001-12/; 2000-2006, http://www.census.gov/popest/states/NST-ann-est.html; 2007, http://factfinder.census.gov/servlet/DTTable?_bm=y&-geo_id=01000US&-ds_name=PEP_2007_EST&-_lang=en&-mt_name=PEP_2007_EST_G2007_T001&-format=&-CONTEXT=dt
Total Drunk-Driving Fatalities Per Million Population 53 percent decline since 1982 Record-Low Level Source: U.S. Department of Transportation, National Highway Traffic Safety Administration; Drunk-driving fatalities represent the total number of fatalities (occupants and nonoccupants) in motor vehicle traffic crashes involving a driver or motorcycle rider with a blood alcohol concentration of .08 or higher. http://www-nrd.nhtsa.dot.gov/Pubs/811017.PDF Source: U.S. Census Bureau, Intercensal population estimates 1980-1989 http://www.census.gov/popest/archives/1980s/st8090ts.txt; 1990-1999, http://www.census.gov/popest/archives/2000s/vintage_2001/CO-EST2001-12/; 2000-2006, http://www.census.gov/popest/states/NST-ann-est.html; 2007, http://factfinder.census.gov/servlet/DTTable?_bm=y&-geo_id=01000US&-ds_name=PEP_2007_EST&-_lang=en&-mt_name=PEP_2007_EST_G2007_T001&-format=&-CONTEXT=dt