Download
1 / 18
180 likes | 374 Views
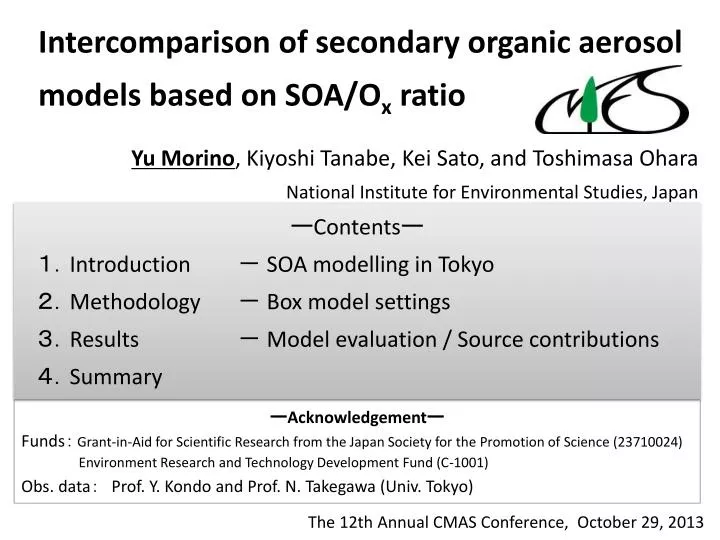
Intercomparison of secondary organic aerosol models based on SOA/O x ratio Yu Morino , Kiyoshi Tanabe, Kei Sato, and Toshimasa Ohara National Institute for Environmental Studies, Japan. ー Contents ー 1. Introduction - SOA modelling in Tokyo 2. Methodology - Box model settings

E N D
Intercomparison of secondary organic aerosol models based on SOA/Ox ratio Yu Morino, Kiyoshi Tanabe, Kei Sato, and ToshimasaOhara National Institute for Environmental Studies, Japan ーContentsー 1.Introduction - SOAmodelling in Tokyo 2.Methodology - Box model settings 3.Results - Model evaluation / Source contributions 4.Summary ーAcknowledgementー Funds:Grant-in-Aid for Scientific Research from the Japan Society for the Promotion of Science (23710024) Environment Research and Technology Development Fund (C-1001) Obs. data: Prof. Y. Kondo and Prof. N. Takegawa(Univ. Tokyo) The 12th Annual CMAS Conference, October 29, 2013
1.Introduction PM2.5 in Japan (2001-2010, annual average) Urban (N=12) Rural (N=5) Roadside (N=16) 2001 2002 2003 2004 2005 2006 2007 2008 2009 2010 • PM2.5 environmental standardin Japan (Sept. 2009 ‒) • Annual mean: 15 μg m-3 • Daily mean: 35 μg m-3 Ministry of Environment [2012]
1.Introduction PM2.5 in Japan (2010-2013, monthly average) ③Summer ④Autumn ④Autumn ①Winter ①Winter ②Spring ②Spring ②Spring ②Spring ②Spring Western Japan # daily PM2.5 > 70 μgm-3 # Stations×day % daily PM2.5 > 35 μgm-3 ①Average PM2.5 was higher than 15μgm-3 in western Japan Monthly average PM2.5 (μgm-3) Eastern Japan (including Tokyo Metropolitan Area) Ministry of Environment [2013] ②Daily PM2.5 exceeds environmental standard in all the seasons. 2012 2010 2011 2013
1.Introduction SOA modelling in Tokyo Metropolican Area (Case study in summer 2007) Model intercomparison of PM2.5 species (Morino et al., JSAE, 2010) (CMAQ v4.7.1 and CMAQ 4.6 were used.) Model evaluation of fossil- and biogenic SOA(Morino et al., ES&T, 2010) (CMAQ –MADRID was used.) Fossil-SOA: Underestimation by a factor of 6-8 Organic aerosol S1: Komae, S2: Kisai, S3: Maebashi, S4: Tsukuba Biogenic-SOA: Underestimation by a factor of 1.5 - 2 All models significantly underestimated OA.
1.Introduction SOA model development – Volatility basis-set (VBS) model VBSmodel SOA (I/S) cond./ evapo. POA Yield model Merit 1 Merit 2 cond./ evapo. Emission sources SVOC3 emis. aging SVOC1 aging SVOC2 emis. SVOC3 SVOC2 aging aging oxidation emis. cond./ evapo. SVOC1 VOC cond./ evapo. SOA (V) Merit 1: Merit 2: Simulate primary emissions and oxidation (aging) of SVOC/IVOC (semi-/intermediate- VOC) Simulate aging processes of oxidation products from VOCs
1.Introduction CACM (caltech chemical mechanism) UR24 UR25 UR26 etc. SOA model development – Chemical modules Yield model (SAPRC99-AERO4) ARO1 + OH = 0.224*HO2 + 0.765*RO2_R + 0.011*RO2_N + 0.055*PROD2 +0.118*GLY + 0.119*MGLY + 0.017*PHEN + 0.207*CRES + 0.059*BALD + 0.491*DCB1 + 0.108*DCB2 + 0.051*DCB3 +0.071*TOLAER1 + 0.138*TOLAER2 Near-explicit model –Explicitly simulate multi-generation reactions MCM (master chemical mechanism)
1.Introduction Objectives • Intercomparison of five SOA models (of different frameworks) to evaluate their characteristics and performance • Preliminary evaluation of volatility basis-set(VBS) model on OA simulation in Tokyo Metropolitan Area
2. Methodology SOA models Five SOA models simulated in this study • MCM, CACM-MADRID: explicitly simulate multi-generation oxidation. • -Vapor pressures used in the MCM model was calculated by EPI-Suite(Stein and Brownmethod). Kpwas multiplied by a actor of 500 (Johnson et al., 2006). • AERO4, AERO5: Yield model • VBS: Grouping of SVOC and IVOC based on volatility (~vapor pressure). • - Speciation of emitted SVOC/IVOC and aging reaction rates was the same with Tsimpidiet al. (2010). from CMAQ-MADRID CMAQ v4.7.1 CMAQ v4.6
2. Methodology Box model framework Obs. site Domain
3. Results Comparison of experimental data and model simulation—high NOxcondition Yi: SOAproduction yield Kom,i:Partitioning coefficient M0: OA concentration ai: stoichiometric coefficient ○Standard ×No aging m-xylene toluene VBS AERO4 AERO5 Obs. • Model simulation of chamber experiment(aromatics VOC + NOx+ HONO) • Aging process enhanced SOA production yield was enhanced by a factor of 1.3 ~ 1.5.
3. Results Comparison of experimental data and model simulation—high NOxcondition Yi: SOAproduction yield Kom,i:Partitioning coefficient M0: OA concentration ai: stoichiometric coefficient ○Standard ×No aging ■reduced Yi m-xylene toluene VBS AERO4 AERO5 Obs. • Model simulation of chamber experiment(aromatics VOC + NOx+ HONO) • Aging process enhanced SOA production yield was enhanced by a factor of 1.3 ~ 1.5. • → Yi should be reduced by 30-50% to avoid double counting.
3. Results Model evaluation in ambient condition – gaseous species O3 OH HO2 NO2 NO HNO3 • O3 and NOx were well reproduced. • OH were reproduced, while HO2 were underestimated. • → should be examined in future studies. • HNO3 were overestimated.(dry deposition)
3. Results Model evaluation using SOA/Ox ratio • Under VOC limited condition (e.g., urban area), VOCs+OH reactions are rate-limiting for Ox(=O3+NO2) and SOA production. • Ox production rate: • SOAproduction rate: • Ratio of SOA and Oxproduction rate Ki : VOC+OH reaction rate Αi: # of HO2,RO2generated from VOC+OHreaction Fi : Fraction of RO2 which produce NO2 Yi : SOAproduction yield SOAformation potential of VOC Oxformation potential of VOC = Obs. S=0.155 mgm-3/ppbv Obs. S=0.155 mgm-3/ppbv VBS—Standard S=0.108 VBS S=0.108 VBS—Reduced yield S=0.084 CACM S=0.046 AERO5S=0.016 AERO4S=0.010 AERO5 AERO4 MCM S=0.004 VBS—No aging S=0.005
3. Results Intercomparison of volatility (C*) distributions SOA (aerosol) SOA+SVOC (total) SVOC (gas) SOA SOA+SVOC (aerosol/total) Saturation concentration Saturation concentration • Continuous C* distributions in VBS and MCM. • MCM simulated very small [SOA+SVOC] with C*<10 μgm-3.
3. Results Contributions of precursors/sources to Ox and SOA Contributions of precursor VOCs were estimate from sensitivity simulations (20% recuction of each VOC). Contributions of each precursor VOC ARO ALK OLE ARO others SVOC OLE Contributions of emission sources Vehicles Vehicles Paint Fugitive Print Paint
4. Summay Summary • Five organic aerosol models (MCM, CACM SAPRC99-AERO4, SAPRC99-AERO5, SAPRC99-VBS) were compared using a box model. • Aging reactions enhanced SOA production yield by a factor of 1.3 ~ 1.5 under conditions of chamber experiments. SOA production yield should be reduced by 30-50% to avoid double counting. • SOA/Ox ratio was well reproduced by the VBS model, while other models significantly underestimated the observed ratio. • Source contributions to ambient SOA concentration largely differed among the five models. Choice of SOA model is critical in the source apportionment of SOA.
3.結果 -ボックスモデル計算結果、寄与解析 3.結果 -ボックスモデル計算結果、寄与解析 モデルー観測データの比較(VOC成分) VOC成分の日変動 NMHC濃度の観測値とモデル計算結果 (期間平均濃度、ppbv) • 上記の比較を基に、VOCの排出量を補正。右図は補正後のVOC濃度。測定成分(C5H8を除いた14成分)のみ補正した点に注意 • MCM, CACM, SAPRC99で芳香族濃度が異なるのは、グルーピングが異なり、OHとの反応速度も異なるため