Download
1 / 12
120 likes | 270 Views
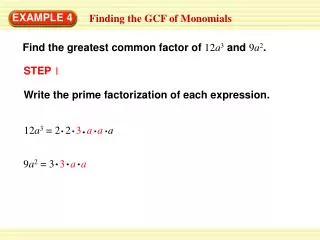
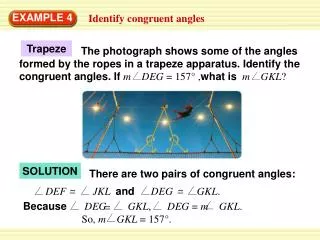
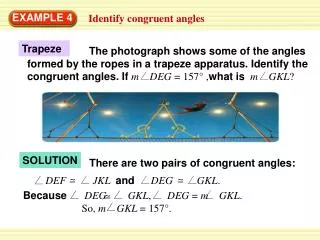
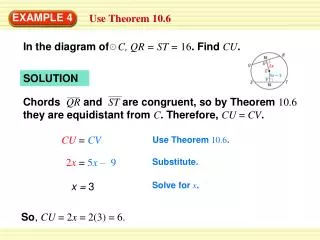
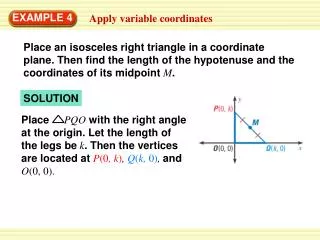
Graph y = –2 sin ( x – ). 2. 3. 2. π. π. 3. 2. Amplitude:. Horizontal shift:. a = –2 = 2. h =. 2. 2 π. 2 π. =. period :. =. 3 π. Vertical shift:. k = 0. 2. b. EXAMPLE 4. Combine a translation and a reflection. SOLUTION. STEP 1.

E N D
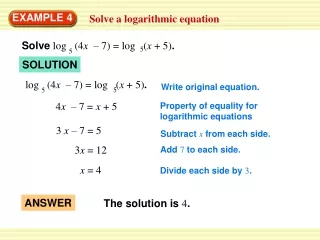
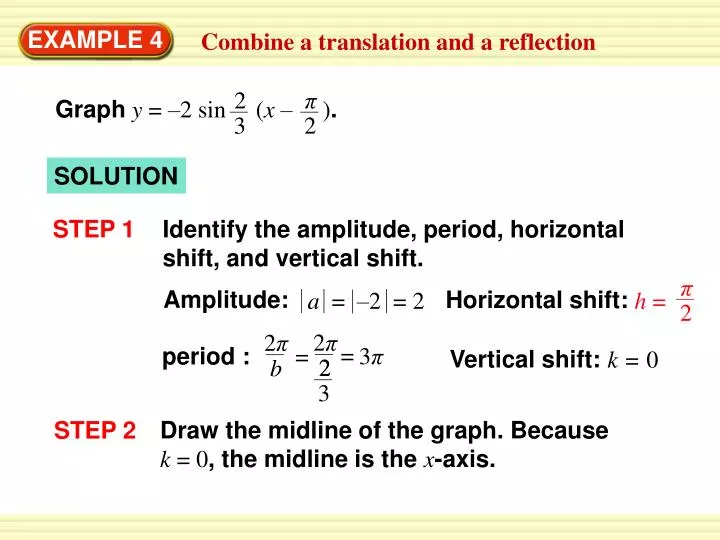
Graphy = –2 sin (x – ). 2 3 2 π π 3 2 Amplitude: Horizontal shift: a = –2 = 2 h = 2 2π 2π = period : = 3π Vertical shift: k = 0 2 b EXAMPLE 4 Combine a translation and a reflection SOLUTION STEP 1 Identify the amplitude, period, horizontal shift, and vertical shift. Draw the midline of the graph. Because k = 0, the midline is the x-axis. STEP 2
STEP 3 Find the five key points of y = –2 sin (x – ). 3π 9π 7π 5π 3π π π π π π π ( + ,2) ( + ,0) ( + ,–2) On y = k: = ( , 0); (0 + ,0) = (2π, 0) 4 4 2 4 2 2 2 2 2 2 2 = ( , 0) (3π+ ,0) 2 π = ( , 2) 2 3 Maximum: 11π ( , –2) Minimum: = 4 STEP 4 Reflect the graph. Because a < 0, the graph is reflected in the midline y = 0. EXAMPLE 4 Combine a translation and a reflection
5π So, ( , 2) becomes ( , –2 ) 4 5π 11π 4 and becomes . ( , 2) 4 11π ( , –2) 4 EXAMPLE 4 Combine a translation and a reflection STEP 5 Draw the graph through the key points.
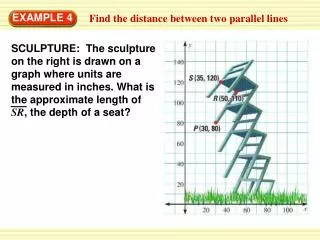
π Period: h = 0 Horizontal shift: k = 5 Vertical shift: Find the asymptotes and key points of y = –3 tanx + 5. EXAMPLE 5 Combine a translation and a reflection Graph y= –3tanx+ 5. SOLUTION STEP 1 Identify the period, horizontal shift, and vertical shift. STEP 2 Draw the midline of the graph, y = 5. STEP 3
π Asymptotes: = x = x = ; – = 2 1 On y = k: = (0, 5) (0, 0 + 5) (– , –3 + 5) Halfway points: = π π (– , 2); 2 2 π π π π π π = π – 4 4 4 4 4 4 2 1 ( , 3 + 5) ( , 8) So, (– , 2) becomes π (– , 8) 4 ( , 8) and π becomes ( , 2) . 4 EXAMPLE 5 Combine a translation and a reflection STEP 4 Reflect the graph. Because a < 0, the graph is reflected in the midline y = 5.
EXAMPLE 5 Combine a translation and a reflection STEP 5 Draw the graph through the key points.
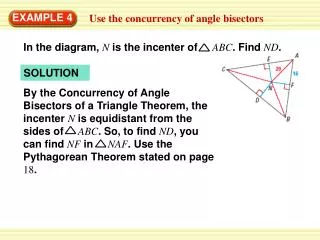
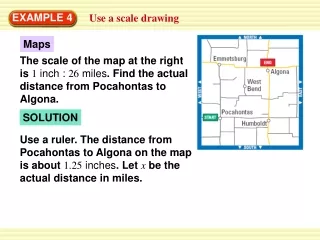
Glass Elevator You are standing 120 feet from the base of a 260 foot building. You watch your friend go down the side of the building in a glass elevator. Write and graph a model that gives your friend’s distance d(in feet) from the top of the building as a function of the angle of elevation q . EXAMPLE 6 Model with a tangent function
opp 260 – d adj tanq = = 120 120 tanq 260 – d = 120 tanq–260 –d = d –120 tanq+260 = EXAMPLE 6 Model with a tangent function SOLUTION Use a tangent function to write an equation relating dand q . Definition of tangent Multiply each side by 120. Subtract 260 from each side. Solve for d. The graph of d = –120 tanq + 260 is shown at the right.
π 2 y = – cos ( x + ) for Examples 4, 5, and 6 GUIDED PRACTICE Graph the function. 4. SOLUTION
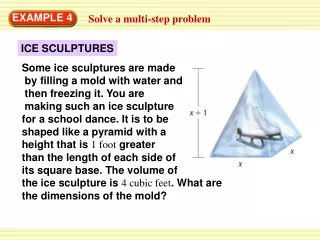
5. y = –3 sin x + 2 1 2 for Examples 4, 5, and 6 GUIDED PRACTICE Graph the function. SOLUTION
6. f(x) = – tan 2 x – 1 for Examples 4, 5, and 6 GUIDED PRACTICE Graph the function. SOLUTION
7. What if ? In example 6, how does the model change if you are standing 150 feet from a building that is 400 feet tall ? ANSWER The graph is shifted 400 units up instead of 260. The new equation would be d = –150 tan q + 400. for Examples 4, 5, and 6 GUIDED PRACTICE