Download

1 / 31
310 likes | 474 Views
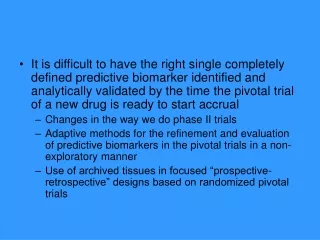
Design Considerations in Molecular Biomarker Discovery Studies. Doris Damian and Robert McBurney June 6, 2007. Outline of Presentation. Introduction: Mass Spectrometry Data Studies objectives and questions Statistical Processing of MS Data Sample normalization

E N D
Design Considerations in Molecular Biomarker Discovery Studies Doris Damian and Robert McBurney June 6, 2007
Outline of Presentation • Introduction: • Mass Spectrometry Data • Studies objectives and questions • Statistical Processing of MS Data • Sample normalization • Removal of peak-specific batch and other temporal trends • Filtering of noisy peaks • Design Considerations • Power calculations – for univariate biomarkers • Power calculations for multivariate biomarkers (regression)
Mass Spectrometry Data Total Ion Chromatogram MS of Individual Peaks biological samples QC samples Selected Ion Chromatogram Figure modified from: http://www.asms.org/whatisms/p13.html • Measurements: chemical compounds of different classes (proteins, lipids, polar and non-polar metabolites, amino acids, etc.) • The variables constituting the data sets are peak intensities (peaks) identified by m/z and retention time. The peak intensities are proportional to the amount of analyte detected by the mass spectrometer. Note that p >> n!
Structure of a Molecular Biomarker Discovery Study Objectives Questions Design Experiment Statistical Processing Data Analysis
Studies Objectives and Questions Objectives Questions Design Experiment Processing Analysis Objectives Diagnosis Elucidation of Mechanisms of Action (MoA) Questions Questions • What are all the biomarkers? • What are the molecular pathways? • What is a minimal set of biomarkers? Biomarker: A characteristic that is objectively measured and evaluated as an indicator of normal biological processes, pathogenic processes, orpharmacologic response(s) to a therapeutic intervention.
Outline of Presentation • Introduction: • Mass Spectrometry Data • Studies objectives and questions • Statistical Processing of MS Data • Sample normalization • Removal of peak-specific batch and other temporal trends • Filtering of noisy peaks • Design Considerations • Power calculations – for univariate biomarkers • Power calculations for multivariate biomarkers (regression)
Statistical Processing • Sample normalization • correction of baseline differences between samples • Removal ofpeak-specific batch and othertemporal trends • due to instrument and processing limitations, samples are acquiredsequentially in batches – peaks exhibit batch-to-batch variation; • instrument performance may become unstable over time, samples may undergo degradation. These are main causes for temporal variation observed in peak intensities. • Filteringof noisy peaks • for each biological sample replicate measurements are obtained; • the estimated correlation between these replicates is used as a filter for noisy data. Presented at IBC’s Biomarkers and Molecular Diagnostic conferences September 2006
Sample Normalization • Correction of baseline differences between samples. • Based on Internal Standards. • Internal Standards are known exogenous compounds, added to the biological samples in fixed amounts at the beginning of the sample preparation stage (same for all samples). • Used to account for sample variability (e.g., pipetting errors) during sample preparation and acquisition.
Sample Normalization • Normalization – the statistical procedure of multivariate scaling of samples based on (a subset of) IS peaks. • Y = log(intensity); i = 1,…,I IS peak; j = 1,…,J sample. • The sample-specific factors, , are estimated in this ANOVA model and removed from all peaks.
Typical Sample Profiles of IS Peaks – after Normalization Through normalization, temporal trendscommon to all peaks are removed.
Typical Temporal Profiles of IS Peaks – before Normalization
Typical Temporal Profiles of IS Peaks – after Normalization
Statistical Processing • Sample normalization • correction of baseline differences between samples • Removal ofpeak-specific batch and othertemporal trends • due to instrument and processing limitations, samples are acquiredsequentially in batches – peaks exhibit batch-to-batch variation; • instrument performance may become unstable over time, samples may undergo degradation. These are main causes for temporal variation observed in peak intensities. • Filtering of noisy peaks • for each biological sample replicate measurements are obtained; • the estimated correlation between these replicates is used as a filter for noisy data.
The Need for Batch Corrections PCA Plot: Data set after Normalization Colored by Batch second principal component first principal component • The within and between batch patterns cause visible batch separations: • If one does not account for these intrinsic experimental trends, important biological effectsmay be obscured.
Removal of Peak-Specific Temporal Trends • Based on QC samples (ideally) • QC samples: a pool of material from the biological samples in a study, aliquoted into a set of identical samples that are acquired at specific intervals in each batch of samples.
Removal of Peak-Specific Temporal Trends Temporal trend within batch b (b=1,…,B batches): estimated based on QC samples within batch b
Statistical Processing • Sample normalization • correction of baseline differences between samples • Removal of peak-specific batch and other temporal trends • due to instrument and processing limitations, samples are acquired sequentially in batches – peaks exhibit batch-to-batch variation; • instrument performance may become unstable over time, samples may undergo degradation. These are main causes for temporal variation observed in peak intensities. • Filteringof noisy peaks • for each biological sample replicate measurements are obtained; • the estimated correlation between these replicates is used as a filter for noisy data.
Correlations between Biological Replicates • When the same sample is measured several times, we require the measurements to correlate well. • The correlation between replicates can be expressed as a tradeoff between the biological variance ( ) and the measurement error variance ( ). • Ideal case: no measurement error . • The estimated correlation, , can be used to filter noisy peaks.
Outline of Presentation • Introduction: • Mass Spectrometry Data • Studies objectives and questions • Statistical Processing of MS Data • Sample normalization • Removal of peak-specific batch and other temporal trends • Filtering of noisy peaks • Design Considerations • Power calculations – for univariate biomarkers • Power calculations for multivariate biomarkers (regression)
Power Calculations • Statistical power = probability to detect biomarkers • The power in biomarker discovery studies is a function of: • The sample size • The separation between the groups (e.g., MFC) • The proportion of biomarkers in the data set • The false discovery rate (FDR) allowed • The platform variability • The within-group variability • Other factors (e.g. other covariates in the model) ?
Power Calculations • Statistical power = probability to detect biomarkers • The power in biomarker discovery studies is a function of: • The sample size • The separation between the groups (e.g., MFC) • The proportion of biomarkers in the data set • The false discovery rate (FDR) allowed • The platform variability • The within-group variability • Other factors (e.g. other covariates in the model) ?
Illustration I: Power Curves : MFC = 1.7 : MFC = 2.0 : MFC = 3.0 solid: FDR 0.1 dashed: FDR 0.2
Illustration I: Power Curves : MFC = 1.7 : MFC = 2.0 : MFC = 3.0 solid: FDR 0.1 dashed: FDR 0.2
Power Curves Not Accounting for the FDR : MFC = 1.7 : MFC = 2.0 : MFC = 3.0 There is no loss in power, (proportion of biomarkers discovered) BUT the FDR may be undesirable. FRD dotted: Estimated FDR
Power Calculation for Multivariate Biomarkers (Regression) Classical Setting • n > p • Linear regression model • Parametric (F) test of model significance • Computationally inexpensive Biomarker Discovery Setting • n << p • Regression with constraints on parameters (elastic net) • Dimensionality reduction needed (through cross-validation) • Non-parametric (label permutations) test of model significance • Computationally very expensive
Illustration: Power for Regression • Model • Multivariate biomarker • Parameter of interest • Test: = 0 • Power = proportion of times that this hypothesis is rejected
Power Calculation – Regression Biomarker with 10 Components (known in advance) Biomarker with 10 Components (buried among 90 other analytes) …10 minutes to calculate …days to calculate