Download
1 / 45
450 likes | 575 Views
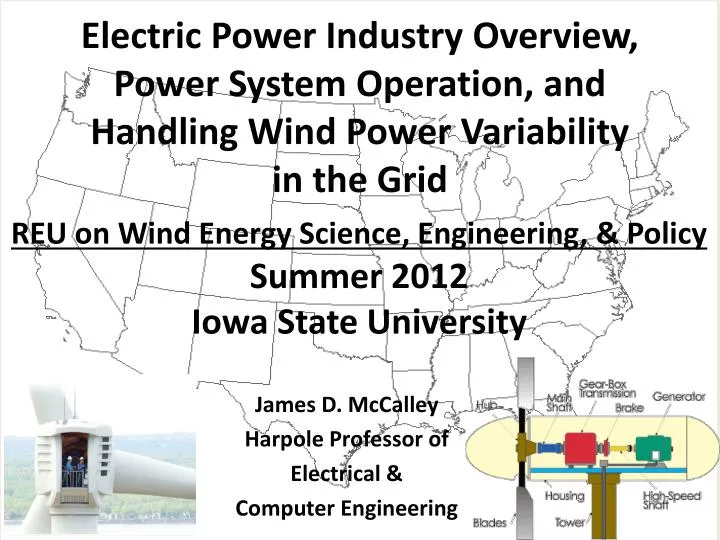
REU on Wind Energy Science, Engineering, & Policy Summer 2012 Iowa State University. Electric Power Industry Overview, Power System Operation, and Handling Wind Power Variability in the Grid. James D. McCalley Harpole Professor of Electrical & Computer Engineering.

E N D
REU on Wind Energy Science, Engineering, & PolicySummer 2012Iowa State University Electric Power Industry Overview, Power System Operation, and Handling Wind Power Variability in the Grid James D. McCalley Harpole Professor of Electrical & Computer Engineering
Outline The electric power industry Control centers Basic problems, potential solutions Wind power equation Variability System Control Comments on potential solutions 2
What are the North American Interconnections? “Synchronized” 3
What is NERC? • NERC: The North American Reliability Corporation, certified by federal government (FERC) as the “electric reliability organization” for the United States. • Overriding responsibility is to maintain North American bulk transmission/generation reliability. Specific functions include maintaining standards, monitoring compliance and enforcing penalties, performing reliability assessments, performing event analysis, facilitating real-time situational awareness, ensuring infrastructure security, trains/certifies system operators. • There are eight NERC regional councils (see below map) who share NERC’s mission for their respective geographies within North America through formally delegated enforcement authority • Western Electricity Coordinating Council (WECC) • Midwest Reliability Organization (MRO) • Southwest Power Pool (SPP) • Texas Reliability Entity (TRE) • Reliability First Corporation (RFC) • Southeast Electric Reliability Council (SERC) • Florida Reliability Coordinating Council (FRCC) • Northeast Power Coordinating Council (NPCC) 4
What is FERC? • An independent agency that regulates the interstate transmission of electricity, natural gas, and oil. It does the following: • Regulates transmission & wholesale sales of electricity in interstate commerce; • Regulates all wholesale natural gas transmission; • Reviews mergers/acquisitions /corporate transactions by electricity companies; • Can review some siting applications for electric transmission projects; • Licenses and inspects private, municipal, and state hydroelectric projects; • Protects the reliability of the high voltage interstate transmission system through mandatory reliability standards; • Monitors and investigates energy markets; • Enforces FERC regulatory requirements via civil penalties/other means; • Oversees environmental matters related to natural gas/hydroelectric projects; • Administers accounting/financial reporting regs+conduct of regulated companies • FERC does not: • Regulate retail electricity and natural gas sales to consumers; • Regulate activities of municipals or federal power marketing agencies; • Regulate nuclear power plants (NRC does this); • Address reliability problems related to failures of local distribution facilities; • Consider tree trimmings near local distribution power lines in residential neighborhoods 5
Organizations comprising the Electric Power Industry • Investor-owned utilities: 210 (MEC, Alliant, Xcel, Exelon, …) • Federally-owned: 10 (TVA, BPA, WAPA, SEPA, APA, SWPA…) • Public-owned: 2009 (Ames, Cedar Falls, Muscatine, …) • Consumer-owned: 912 (Dairyland, CIPCO, Corn Belt, …) • Non-utility power producers: 1934(Alcoa, DuPont,…) • Power marketers: 400 (e.g., Cinergy, Mirant, Illinova, Shell Energy, PECO-Power Team, Williams Energy,…) • Coordination organizations: 9(ISO-NE, NYISO, PJM, MISO, SPP, ERCOT, CAISO, AESO, NBSO), 7 are in the US. • Oversight organizations: • Regulatory: 52 state, 1 Fed (FERC) • Reliability: 1 National (NERC), 8 regional entities • Environment: 52 state (DNR), 1 Fed (EPA) • Manufacturers: GE, ABB, Toshiba, Schweitzer, Westinghouse,… • Consultants: Black&Veatch, Burns&McDonnell, HD Electric,… • Vendors: Siemens, Areva, OSI,… • Govt agencies: DOE, National Labs,… • Professional organizations: IEEE PES … • Advocacy organizations:AEWA, IWEA, Wind on Wires… • Trade Associations: EEI, EPSA, NAESCO, NRECA, APPA, PMA,… • Law-making bodies: 52 state legislatures, US Congress 6
Transmission and System Operator G G G G G G G G G G G G Independent System Operator G Transmission Operator Transmission Operator Transmission Operator G Today G G Independent System Operator Vertically Integrated Utility 1900-1996/2000 8
What are ISOs? • The regional system operator: monitors and controls grid in real-time • The regional market operator: monitors and controls the electricity markets • The regional planner: coordinates the 5 and 10 year planning efforts • Also the Regional Transmission Organization (RTO) • They do not own any electric power equipment! • None of them existed before 1996! • California ISO (CAISO) • Midwest ISO (MISO) • Southwest Power Pool (SPP) • Electric Reliability Council of Texas (ERCOT) • New York ISO (NYISO) • ISO-New England (ISO-NE) • Pennsylvania-Jersey-Maryland (PJM) 9
What is a Balancing Authority (BA)? • From NERC: A BA is the responsible entity that integrates resource plans ahead of time, maintains load-interchange-generation balance within a Balancing Authority Area, and supports Interconnection frequency in real time. This means it is the organization responsible for performing the load/generation balancing function. • All ISOs are BAs; many BAs are not ISOs. 105 BAs in NA; 67 in EI, 38 in WI, 1 in Tx • Main functions of BA: Automatic Gen Control (AGC) but also may perform unit commitment and dispatch. • Unit commitment: Determine in the next time interval (week, 2 day, 24 hrs, 4 hrs) which gen units should be connected (synchronized). • Dispatch: Determine in the next time interval (1 hr, 15 mins, 5 mins), what should be the MW output for each committed gen unit. • AGC: Maintain frequency at 60Hz in the interconnection, ensure load changes in the BA are met by gen changes in the BA, maintain tie line flows at scheduled levels. 10
Energy Control Centers • Energy Control Center (ECC): • SCADA, EMS, operational personnel • “Heart” (eyes & hands, brains) of the power system • Supervisory control & data acquisition (SCADA): • Supervisory control: remote control of field devices, including gen • Data acquisition: monitoring of field conditions • SCADA components: • Master Station: System “Nerve Center” located in ECC • Remote terminal units: Gathers data at substations; sends to Master Station • Communications: Links Master Station with Field Devices, telemetry is done by either leased wire, PLC, microwave, or fiber optics. • Energy management system (EMS) • Topology processor & network configurator • State estimator and power flow model development • Automatic generation control (AGC), Optimal power flow (OPF) • Security assessment and alarm processing 11
ECCs: EMS & SCADA Remote terminal unit Substation SCADA Master Station Communication link Energy control center with EMS EMS alarm display EMS 1-line diagram 12
Electricity “two settlement” markets Internet system Energy & reserve offers from gens Day-Ahead Market (every day) Which gens get committed, at roughly what levels for next 24 hours, and settlement Energy bids from loads Energy offers from gens Internet system Generation levels for next 5 minutes and settlement for deviations from day-ahead market Real-Time Market (every 5 minutes) Energy bids from loads 16
CAISO market design Schedules entire “next-day” 24hr period. Schedules interchange for entire “next-day” 24hr period, starting at current hour, optimizing one hour at a time (1 value per hr) Computes dispatch every 5 minutes. 17
Locational marginal prices • One for each bus in the network. • Three components – see above. • If the network is lossless, and the transmission capacity is infinite, then all buses have the same LMP. 18
RT LMPs in the MISO and PJM balancing areas 7:20 am (CST) 9/8/2011 19
RT LMPs in the MISO and PJM balancing areas 7:40 am (CST) 9/8/2011 20
Market clearing price L. Tesfatsion, “Auction Basics for Wholesale Power Markets: Objectives and Pricing Rules,” Proceedings of the 2009 IEEE Power and Energy Society General Meeting, July, 2009. Computed as the price where the supply schedule intersects the demand schedule. SUPPLY Price ($/MWhr) DEMAND Quantity (MWhr) 22
Market clearing price L. Tesfatsion, “Auction Basics for Wholesale Power Markets: Objectives and Pricing Rules,” Proceedings of the 2009 IEEE Power and Energy Society General Meeting, July, 2009. Computed as the price where the supply curve intersects the demand curve. SUPPLY Price ($/MWhr) Colored areas give market surplus, which is maximized at clearing price. DEMAND Quantity (MWhr) 23
Day-ahead LMPs in ISO-NE balancing areas For hour ending 11:00 am (EST) 9/8/2011 New England ISO website, at http://www.iso-ne.com/portal/jsp/lmpmap/Index.jsp. 25
RT LMPs in the ISO-NE balancing areas 10:25 am (EST) 9/8/2011 New England ISO website, at http://www.iso-ne.com/portal/jsp/lmpmap/Index.jsp. 26
RTAncillary service prices in ISO-NE bal areas TMSR=10min spinning rsrv TMNSR=10min non-spinning rsrv TMOR=30min operating rsrv Regulation clearing price is $5.11/MW. Load Zones: Connecticut (CT), Southwest CT (SWCT), Northeast Massachusetts/Boston (NEMABSTN) 10:25 am (EST) 9/8/2011 New England ISO website, at http://www.iso-ne.com/portal/jsp/lmpmap/Index.jsp. 27
How does wind participate in markets? Wind is price-taker. Demand schedule without wind Point X Price ($/MWhr) Demand schedule with wind Point Y Supply schedule Quantity (MWhr) • “Old” approach #2. • Participates in day-ahead energy • Does not participate in AS or RT • Wind generates what it can • No deviation penalties • Paid based on computed LMP with wind, Point Y below • Marginal unit backed off • Assumes wind satisfies lowest “willing to pay” load 28
How does wind participate in markets? • “New” Midwest ISO approach: • Dispatchable intermittent resource (DIR) • Participates in day-ahead energy • Makes offer into RT market like any other generator. But one unique DIR feature: • Instead of capacity max offered in by other generation resources, the forecasted wind MW is used as the operation capacity maximum; • Units are expected to follow the dispatch signal; • Units missing “schedule band” of 8% on either side dispatch instruction for four consecutive 5-min periods are penalized. • What are implications? Midwest ISO Market Subcom, “Dispatchable Intermittent Resource Implementation Guide,” March 1, 2011, at www.midwestiso.org/Library/Repository/Meeting%20Material/Stakeholder/MSC/2011/20110301/20110301%20MSC%20Item%2012a%20DIR%20Implementation%20Update.pdf. 29
How does wind participate in markets? • What are implications? • Wind is dispatchable! Forecasting is key! • DIRs are expected to provide rolling forecast of 12 five-minute periods for the Forecast Maximum Limit. • If forecast not submitted in time, MISO forecast is used. • Each 5 minute dispatch optimization uses Forecast Maximum Limit based on the following order • 1. Participant submitted Forecast for the interval • Must be less than or equal to the Feasibility Limit • Must have been submitted less than 30 minutes ago • 2.MISO Forecast • Must be less than or equal to the Feasibility Limit • Must have been created less than 30 minutes ago • 3.State Estimator 30
Why is DIR beneficial? • DIRs are more likely to reduce output when LMP is negative because dispatch will instruct them to reduce; there are penalties for not following dispatch. • Inclusion of the DIRs in the RT dispatch will give SCED more flexibility to manage constraints. Therefore, there will be fewer manual curtailments: • Benefits wind for increased MWhrs produced • Benefits to system because wind offers low and therefore affects all time periods some (has very large effect during peak periods) – see next slide. 31
Why is DIR beneficial? Difference in prices with (solid) and without (dashed) wind. Slanted lines are demand curves for night, day, and peak. Without wind, prices are slightly higher at night, significantly higher during the day, and much higher during the peak. “Wind energy and Electricity Prices: Exploring the “merit order effect”,” a literature review by Poyry for the European Wind Energy Association, April , 2010., available at www.ewea.org/fileadmin/ewea_documents/documents/publications/reports/MeritOrder.pdf. 32
Power production Wind Power Equation • So power extracted depends on • Design factors: • Swept area, At • Environmental factors: • Air density, ρ (~1.225kg/m3 at sea level) • Wind speed v3 • 3. Control factors affecting performance coefficient CP: • Tip speed ratio through the rotor speed ω • Pitch θ 33
Basic problems with wind & power balance Wind is a variable resource when maximizing energy production Definition: NETLOAD.MW=LOAD.MW-WIND.MW Fact: Wind increases NETLOAD.MW variability in grid Fact: Grid requires GEN.MW=NETLOAD.MW always Fact: “Expensive” gens move (ramp) quickly, “cheap” gens don’t, some gens do not ramp at all. Problem: Increasing wind increases need for more and “faster” resources to meet variability, increasing cost of wind. Wind is an uncertain resource Fact: Market makes day-ahead decisions for “unit commitment” (UC) based on NETLOAD.MW forecast. Fact: Large forecast error requires available units compensate. Problem: Too many (under-forecast) or too few (over-forecast) units may be available, increasing the cost of wind. 34
Groups of 2-3, 5 minutes • Identify your preferred approach to the variability problem • Consider the below solutions, one, or combination, or other • Identify reasons (e.g., economics, effectiveness, sustainability) and have one person report to class at end of 10 minutes Solutions to variability & uncertainty We have always dealt with variability and uncertainty in the load, so no changes are needed. Increase MW control capability during periods of expected high variability via control of the wind power. Increase MW control capability during periods of expected high variability via more conventional generation. Increase MW control capability during periods of expected high variability using demand control. Increase MW control capability during periods of expected high variability using storage. 35
Wind Power Temporal & Spatial Variability JULY2006 JANUARY2006 Blue~VERY LOW POWER; Red~VERY HIGH POWER • Notice the temporal variability: • lots of cycling between blue and red; • January has a lot more high-wind power (red) than July; • Notice the spatial variability • “waves” of wind power move through the entire Eastern Interconnection; • red occurs more in the Midwest than in the East 36
= + Load Following Regulation MW-Hz Time Frames Source: Steve Enyeart, “Large Wind Integration Challenges for Operations / System Reliability,” presentation by Bonneville Power Administration, Feb 12, 2008, available at http://cialab.ee.washington.edu/nwess/2008/presentations/stephen.ppt. 37
How Does Power System Handle Variability Turbine-Gen N Turbine-Gen … Turbine-Gen 2 Turbine-Gen 1 ACE=∆Ptie +B∆f Primary control provides regulation Secondary control provides load following ∆f ∆Ptie 41
42 Characterizing Netload Variability ∆T HISTOGRAM Measure each ∆T variation for 1 yr (∆T=1min, 5min, 1 hr) Identify “variability bins” in MW Count # of intervals in each variability bin Plot # against variability bin Compute standard deviation σ. Regulation Load following Loads: 2011: 12600 MW 2013: 12900 MW 2018: 13700 MW Ref: Growing Wind; Final Report of the NYISO 2010 Wind Generation Study, Sep 2010. www.nyiso.com/public/webdocs/newsroom/press_releases/2010/GROWING_WIND_-_Final_Report_of_the_NYISO_2010_Wind_Generation_Study.pdf
Do nothing: fossil-plants provide reg & LF (and die ). • Improve forecasts (M2) • Increase control of the wind generation • Control wind to band around forecasted value (M3) • Provide wind with primary control • Reg down (4%/sec), but spills wind following the control • Reg up, but spills wind continuously • Limit wind generation ramp rates • Limit of increasing ramp is easy to do • Limit of decreasing ramp is harder, but good forecasting can warn of impending decrease and plant can begin decreasing in advance • Increase non-wind MW ramping capability during periods of expected high variability using one or more of the below (M1): • Conventional generation • Load control • Storage • Expand control areas • Combine control areas (M4) Solutions to variability & uncertainty 43
Why Does Variability Matter? • NERC penalties for poor-performance • Consequences of increased frequency variblty: • Some loads may lose performance (induction motors) • Relays can operate to trip loads (UFLS), and gen (V/Hz) • Lifetime reduction of turbine blades • Frequency dip may increase for given loss of generation • Areas without wind may regulate for windy areas • Consequences of increased ACE variability (more frequent MW corrections): • Increased inadvertent flows • Increase control action of generators • Regulation moves gen “down the stack” cycling! 44
First, primary frequency control for over-frequency conditions, which requires generation reduction, can be effectively handled by pitching the blades and thus reducing the power output of the machine. Although this action “spills” wind, it is effective in providing the necessary frequency control. Second, primary frequency control for under-frequency conditions requires some “headroom” so that the wind turbine can increase its power output. This means that it must be operating below its maximum power production capability on a continuous basis. This also implies a “spilling” of wind. Question: Should we “spill” wind in order to provide frequency control, in contrast to using all wind energy and relying on some other means to provide the frequency control? Answer: Need to compare system economics between increased production costs from spilled wind, and increased investment, maint, & production costs from using storage & conventional gen. How to decide? 45