Download
1 / 4
40 likes | 45 Views
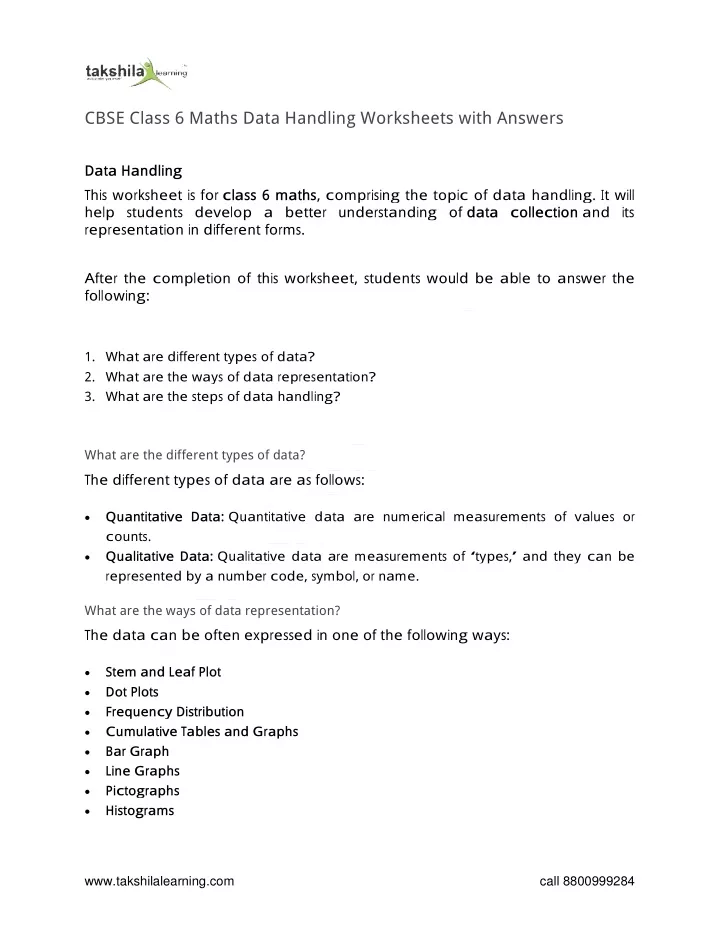
CBSE Class 6 Maths Data Handling Worksheets with Answers This worksheet is for class 6 maths, comprising the topic of data handling It will help students develop a better understanding of data collection and its representation in different forms

E N D
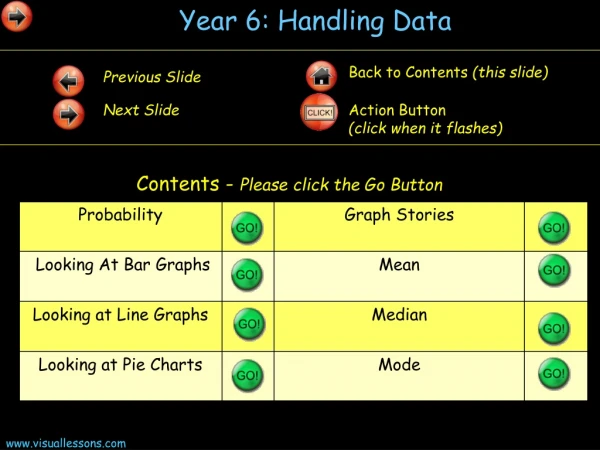
CBSE Class 6 Maths Data Handling Worksheets with Answers Data Handling This worksheet is for class 6 maths, comprising the topic of data handling. It will help students develop a better understanding of data collection and its representation in different forms. After the completion of this worksheet, students would be able to answer the following: 1.What are different types of data? 2.What are the ways of data representation? 3.What are the steps of data handling? What are the different types of data? The different types of data are as follows: Quantitative Data: Quantitative data are numerical measurements of values or counts. Qualitative Data: Qualitative data are measurements of ‘types,’ and they can be represented by a number code, symbol, or name. What are the ways of data representation? The data can be often expressed in one of the following ways: Stem and Leaf Plot Dot Plots Frequency Distribution Cumulative Tables and Graphs Bar Graph Line Graphs Pictographs Histograms www.takshilalearning.com call 8800999284
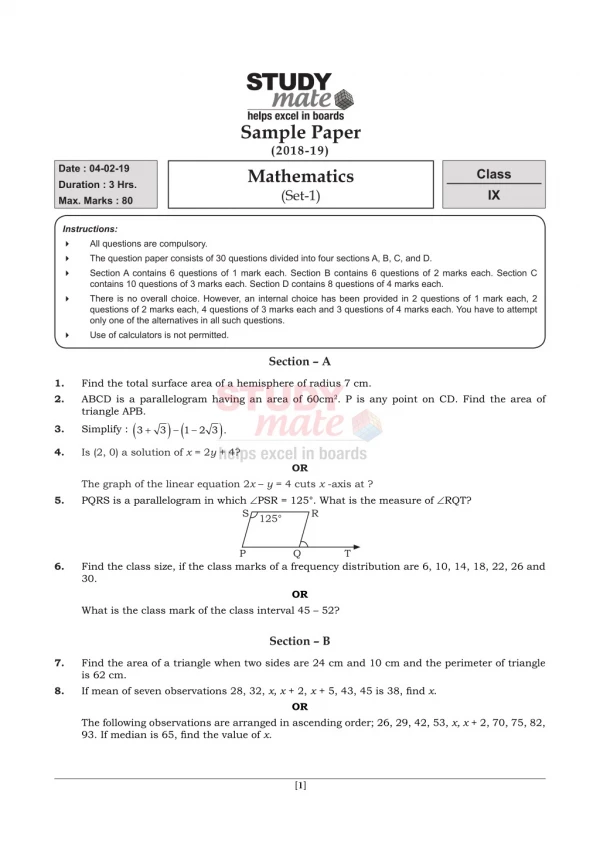
What are the steps of data handling? In the data handling process, below are the steps involved: Step I: In the very first step of this process, the problem statement should be identified as well as defined thoroughly. Step II: The appropriate data for the particular problem statement needs to be collected. Step III: The data gathered should be presented in a meaningful and understandable manner. It is possible to accomplish this by organising the collected data in tally marks, table shapes, and other similar formats. Step IV: Because a graphical or visual representation of the data makes analysis and comprehension easier, the data can be displayed in graphs, charts, such as bar graphs and pie charts, and many more. Step V: The data should be analysed so that the essential information can be derived from the data, allowing for subsequent actions to be taken. Step VI: We may deduce the solution to the statement of the problem from the data analysis. Now that we have understood how data is collected and analysed, let’s look at some problems and try to analyse the data. 1. In August 2014, children from six societies of J aipur were given pulse polio Drops. The society wise number of children was as follows: Represent the data by pictograph. 2. The bar graph represents the frequency of vowels in English Paragraph writing. 1.Which of the following letters appeared less than 30 times? 2.Which letter appeared the most? 3.Which letter did you find 40 times? 4.Make a list of all of the vowels in decreasing order of frequency. 3. The below table represents the marks obtained by 6 students in English. For each name, use a scale of 0.5 cm on the horizontal axis, and 0.5 cm for the same number of marks on the vertical axis. www.takshilalearning.com call 8800999284
Data Handling Worksheets ANSWER 1. Pictograph: www.takshilalearning.com call 8800999284
2. 1.Letter “o” appeared less than 30 times. 2.Letter “i” appeared the maximum number of times. 3.Letter “a” appeared 40 times. 4.i, e, u, a, o is the decreasing order of all frequencies. 3. The required bar graph is represented as: CBSE Class 6 Maths Data Handling Worksheets with Answers Download PDF www.takshilalearning.com call 8800999284