Download
1 / 1
10 likes | 118 Views
NO, 9 環境負荷低減・資源高効率利用技術の 開発プロジェクト A practical project for reducing environmental impact and development technology of high efficiency utilization of resources. Project participate : Di Wu , Q iyu Chen, Shinichi Nakamura, Xiumin Gong, Noboaki Kashiwagi Supervisor : Seiyo O.

E N D
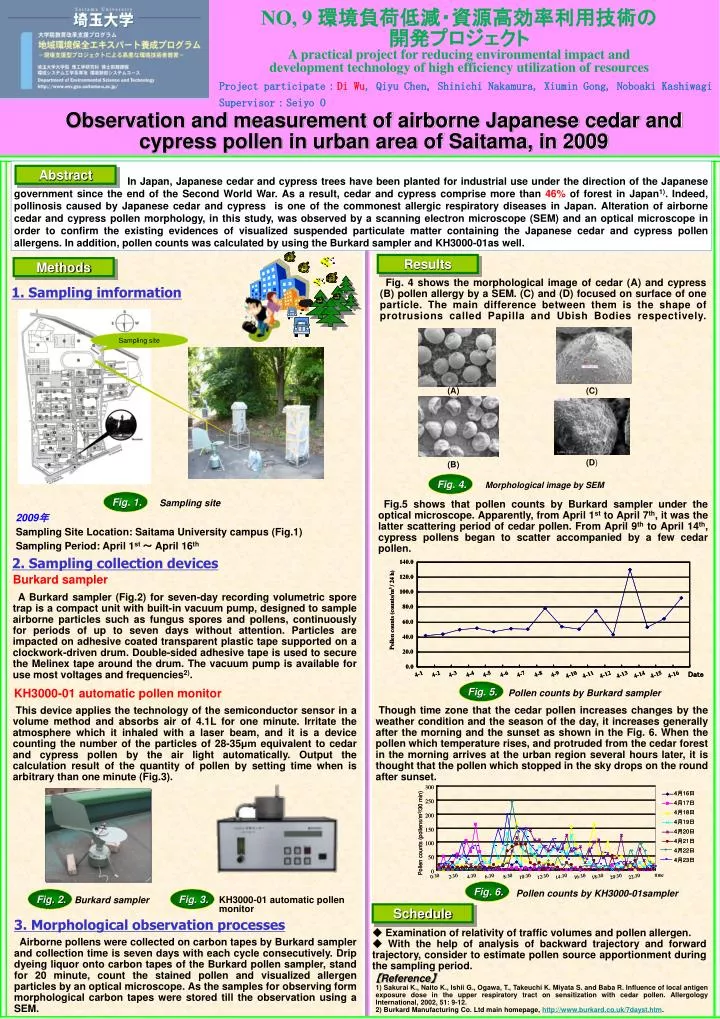
NO, 9環境負荷低減・資源高効率利用技術の 開発プロジェクト A practical project for reducing environmental impact and development technology of high efficiency utilization of resources Project participate:Di Wu, Qiyu Chen, Shinichi Nakamura, Xiumin Gong, Noboaki Kashiwagi Supervisor:Seiyo O Observation and measurement of airborne Japanese cedar and cypress pollen in urban areaof Saitama, in 2009 In Japan, Japanese cedar and cypress trees have been planted for industrial use under the direction of the Japanese government since the end of the Second World War. As a result, cedar and cypress comprise more than 46% of forest in Japan1). Indeed, pollinosis caused by Japanese cedar and cypress is one of the commonest allergic respiratory diseases in Japan. Alteration of airborne cedar and cypress pollen morphology, inthis study,was observedby a scanning electron microscope (SEM)and an optical microscope in order to confirm the existing evidences of visualized suspended particulate matter containing the Japanese cedar and cypress pollen allergens.In addition, pollen counts was calculated by using the Burkard samplerand KH3000-01as well. Abstract Results Methods Fig. 4 shows the morphological image of cedar (A) and cypress (B) pollen allergy by a SEM. (C) and (D) focused on surface of one particle. The main difference between them is the shape of protrusions called Papilla and Ubish Bodies respectively. 1. Sampling imformation Sampling site (C) (A) (D) (B) Fig. 4. Morphological image by SEM Fig. 1. Fig.5 shows that pollen counts by Burkard sampler under the optical microscope. Apparently, from April 1st to April 7th, it was the latter scattering period of cedar pollen. From April 9th to April 14th, cypress pollens began to scatter accompanied by a few cedar pollen. Sampling site 2009年 Sampling Site Location: Saitama University campus (Fig.1) Sampling Period:April 1st ~ April 16th 2. Sampling collection devices Burkard sampler A Burkard sampler (Fig.2) for seven-day recording volumetric spore trap is a compact unit with built-in vacuum pump, designed to sample airborne particles such as fungusspores and pollens, continuously for periods of up to seven days without attention. Particles are impacted on adhesive coated transparent plastic tape supported on a clockwork-driven drum. Double-sided adhesive tape is used to secure the Melinex tape around the drum. The vacuum pump is available for use most voltages and frequencies2). This device applies the technology of the semiconductor sensor in a volume method and absorbs air of 4.1L for one minute. Irritate the atmosphere which it inhaled with a laser beam, and it is a device counting the number of the particles of 28-35μm equivalent to cedar and cypress pollen by the air light automatically. Output the calculation result of the quantity of pollen by setting time when is arbitrary than one minute (Fig.3). Fig. 5. KH3000-01 automatic pollen monitor Pollen counts by Burkard sampler Though time zone that the cedar pollen increases changes by the weather condition and the season of the day, it increases generally after the morning and the sunset as shown in the Fig.6. When the pollen which temperature rises, and protruded from the cedar forest in the morning arrives at the urban region several hours later, it is thought that the pollen which stopped in the sky drops on the round after sunset. Fig. 6. Pollen counts by KH3000-01sampler Fig. 2. Fig. 3. KH3000-01 automatic pollen monitor Burkard sampler Schedule 3. Morphological observation processes ◆ Examination of relativity of traffic volumes and pollen allergen. ◆ With the help of analysis of backward trajectory and forward trajectory, consider to estimate pollen source apportionment during the sampling period. Airborne pollens were collected on carbon tapes by Burkard sampler and collection time is seven days with each cycle consecutively. Drip dyeing liquor onto carbon tapes of the Burkard pollen sampler, stand for 20 minute, count the stained pollen and visualized allergen particles by anoptical microscope. As the samples for observing form morphological carbon tapes were stored till the observation using a SEM. 【Reference】 1) Sakurai K., Naito K., Ishii G., Ogawa, T., Takeuchi K. Miyata S. and Baba R. Influence of local antigen exposure dose in the upper respiratory tract on sensitization with cedar pollen. Allergology International, 2002, 51:9-12. 2) Burkard Manufacturing Co. Ltd main homepage, http://www.burkard.co.uk/7dayst.htm.