Download
1 / 28
280 likes | 444 Views
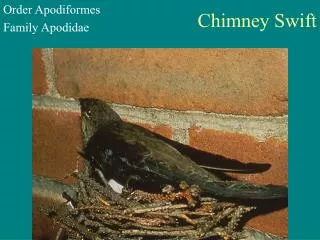
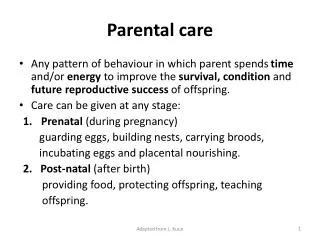
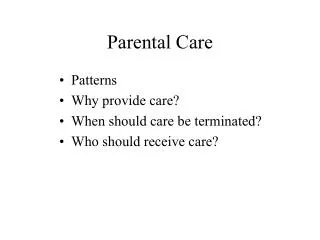
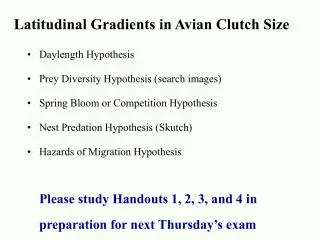
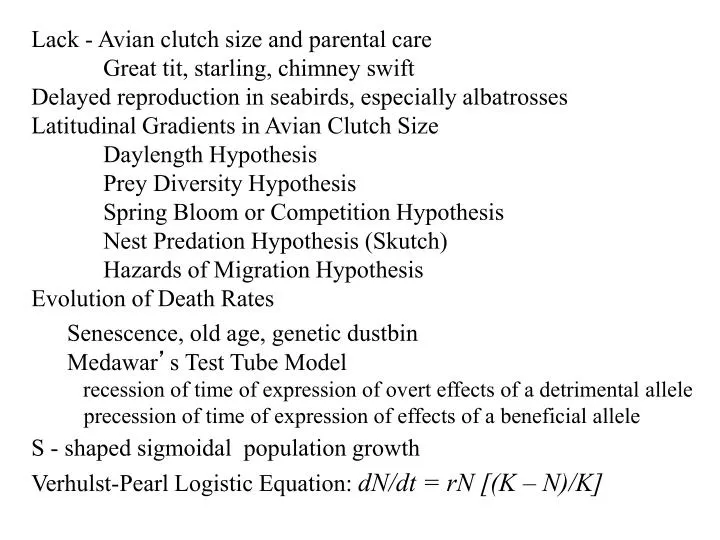
Lack - Avian clutch size and parental care Great tit, starling, chimney swift Delayed reproduction in seabirds, especially albatrosses Latitudinal Gradients in Avian Clutch Size Daylength Hypothesis Prey Diversity Hypothesis Spring Bloom or Competition Hypothesis

E N D
Lack - Avian clutch size and parental care • Great tit, starling, chimney swift • Delayed reproduction in seabirds, especially albatrosses • Latitudinal Gradients in Avian Clutch Size • Daylength Hypothesis • Prey Diversity Hypothesis • Spring Bloom or Competition Hypothesis • Nest Predation Hypothesis (Skutch) • Hazards of Migration Hypothesis • Evolution of Death Rates • Senescence, old age, genetic dustbinMedawar’s Test Tube Modelrecession of time of expression of overt effects of a detrimental allele precession of time of expression of effects of a beneficial allele • S - shaped sigmoidal population growth • Verhulst-Pearl Logistic Equation: dN/dt = rN [(K – N)/K]
S - shaped sigmoidal population growth ( KN K K ( —
Verhulst-Pearl Logistic Equation dN/dt = rN {1– (N/K)} = rN [(K – N)/K]dN/dt = rN {1– (N/K)} = rN [K/K – N/K]dN/dt = rN {1– (N/K)} = rN [1 – N/K]dN/dt = rN – rN (N/K) = rN – {(rN2)/K} dN/dt = rN (1 – N/K) = rN – (r/K)N2 dN/dt = 0when[(K – N)/K] = 0[(K – N)/K] = 0when N = K
Inhibitory effect of each individual on its own population growth is 1/K ra = rmax – rmax ( / K)N
Derivation of Verhulst–Pearl logistic equation At equilibrium, birth rate must equal death rate, bN = dNbN = b0 – x N dN = d0 + y N b0 – x N = d0 + y NSubstituting K for N at equilibrium and r for b0 – d0 r = (x + y) K or K = r/(x +y)
Derivation of the Logistic Equation Derivation of the Verhulst–Pearl logistic equation is easy. Write an equation for population growth using the actual rate of increase rN dN/dt = rN N = (bN – dN) N Substitute the equations for bNand dN into this equation dN/dt = [(b0 – xN) – (d0 + yN)] N Rearrange terms, dN/dt = [(b0 – d0 ) – (x + y)N)] N Substituting r for (b – d) and, from before, r/K for (x + y), multiplying through by N, and rearranging terms, dN/dt = rN – (r/K)N2
Density Dependence versus Density Independence Dramatic Fish Kills, Illustrating Density-Independent Mortality ___________________________________________________ Commercial Catch Percent ––––––––––––––––––––– Locality Before After Decline ___________________________________________________ Matagorda 16,919 1,089 93.6 Aransas 55,224 2,552 95.4 Laguna Madre 12,016 149 92.6 ___________________________________________________ Note: These fish kills resulted from severe cold weather on the Texas Gulf Coast in the winter of 1940.
Some of the Correlates of r- and K-Selection _______________________________________________________________________________________ r-selection K-selection _______________________________________________________________________________________ Climate Variable and unpredictable; uncertain Fairly constant or predictable; more certain Mortality Often catastrophic, nondirected, More directed, density dependent density independent Survivorship Often Type III Usually Types I and II Population size Variable in time, nonequilibrium; Fairly constant in time, ibrium; usually well below equilibrium; at or near carrying capacity of environment; carrying capacity of the unsaturated communities or environment; saturated portions thereof; ecologic vacuums; communities; no recolonization recolonization each year necessary Intra- and inter- Variable, often lax Usually keen specific competition Selection favors 1. Rapid development 1. Slower development 2. High maximal rate of 2. Greater competitive ability increase, rmax 3. Early reproduction 3. Delayed reproduction 4. Small body size 4. Larger body size 5. Single reproduction 5. Repeated reproduction 6. Many small offspring 6. Fewer, larger progeny Length of life Short, usually less than a year Longer, usually more than a year Leads to Productivity Efficiency Stage in succession Early Late, climax __________________________________________________________________
Mola mola Dr. Kirk Winemiller Texas A & M. Univ. Sturgeon Gambusia Sharks, skates, and Rays Mosquito Fish
Sequoia Tree Dr. Kirk Winemiller Texas A & M. Univ. Dandelion Cocoa Nut Tree
Frequencies of Positive and Negative Correlations Between Percentage Change in Density and Population Density for a Variety of Populations in Different Taxa _________________________________________________________________ Numbers of Populations in Various Categories Positive Positive Negative Negative Negative Taxon (P<.05) (Not sig.) (Not sig.) (P<.10) (P < .05) Total _________________________________________________________________ Inverts 0 0 0 0 4 4 Insects 0 0 7 1 7 15 Fish 0 1 2 0 4 7 Birds 0 2 32 16 43 93 Mammals 1* 0 4 1 13 19 Totals 1* 3 45 18 71 138 __________________________________________________________________ * Homo sapiens
Population “Cycles” • Sunspot Hypothesis • Time Lags • Stress Phenomena Hypothesis • Predator-Prey Oscillations • Epidemiology-Parasite Load Hypothesis • Food Quantity Hypothesis • Nutrient Recovery • Other Food Quality Hypotheses • Genetic Control Hypothesis
Sunspot Hypothesis(Sinclair et al. 1993. Am. Nat.) 10 year cycle embedded within 30-50 year periods Maunder minimum: 1645-1715 Three periods of high sunspot maxima: 1751-1787 1838-1870 1948-1993 Canadian Government survey 1931-1948 Hare cycle synchronized across North America Yukon: 5km strip, tree growth rings (N = 368 trees) One tree germinated in 1675 (>300+ years old) Hares prefer palatable shrubs, but will eat spruce leaving dark tree ring marks
Population “Cycles” • Sunspot Hypothesis • Time Lags • Stress Phenomena Hypothesis • Predator-Prey Oscillations • Epidemiology-Parasite Load Hypothesis • Food Quantity Hypothesis • Nutrient Recovery • Other Food Quality Hypotheses • Genetic Control Hypothesis
Other Food Quality Hypotheses: Microtus: palatability <–––> toxic (Freeland 1974) Snowshoe hares: Plant chemical defenses against herbivory
Chitty’s “Genetic Control” Hypothesis Could optimal reproductive tactics be involved in driving population cycles?