Download
1 / 23
230 likes | 447 Views
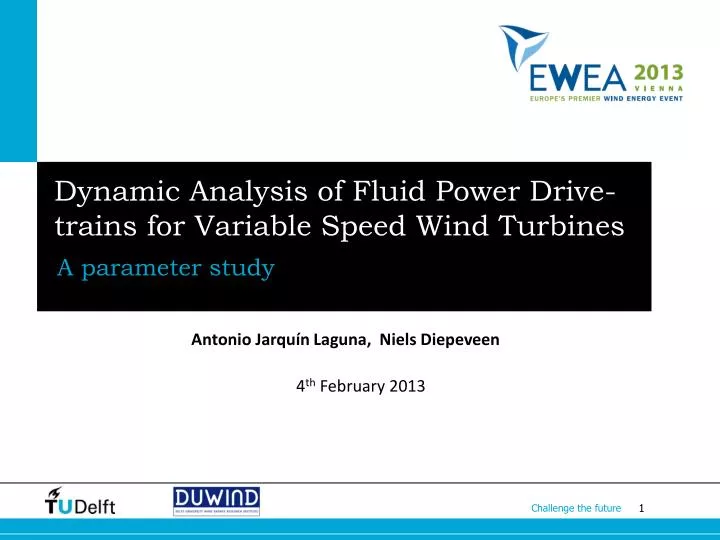
Dynamic Analysis of Fluid Power Drive-trains for Variable Speed Wind Turbines. A parameter study. Antonio Jarqu ín Laguna, Niels Diepeveen. 4 th February 2013. Fluid power drivetrains. Hagglunds- proprietary. Artemis - proprietary. Torque Pressure difference

E N D
Dynamic Analysis of Fluid Power Drive-trains for Variable Speed Wind Turbines A parameter study Antonio Jarquín Laguna, Niels Diepeveen 4th February 2013
Fluid power drivetrains Hagglunds- proprietary Artemis - proprietary Torque Pressure difference Rot Speed Volumetric flow rate -------------------------------------------------- Mech PowerHydraulic Power
Fluid power drivetrains Some background • Not a new idea i.e. different projects in the 80’s • What has changed? • New interest by several parties around the world • Different concepts 1,3 MW BENDIX/Shackle project (USA)
Why use hydraulics transmissions in WE? Some benefits Main challenges • Continuous variable transmission ratio is possible -> use of synch generator, -> eliminate most of power electronics • High torque to weight ratio (compact) -> lighter nacelle -> reduce structural steel • Modular -> ease for maintenance and replacement • Construction material is steel -> not copper or rare earth materials • Efficiency is still the main concern -> Hydraulic solutions still offer solid economic benefits • Limited availability of multi MW components -> so far no commercial need • Without a track record in WE -> more prototypes and public data is needed
Possible configurations Tower based solution Nacelle solution
How to evaluate the dynamic performance? This research • Present a dynamic model of a fluid power transmission and its control for variable speed turbines • Parametric study through numerical simulations • Hydraulic line length • Oil internal leakages in hydraulic drives • Rotor mass moment of inertia
Approach Standard industry software: GH Bladed External controller interface (DLL)
Parameter study for a 5MW turbine Use the same rotor as the NREL 5MW turbine reference • Define reference properties -> Flow rate: 10, 000 lpm -> Pressure: 350 bar NREL 5MW rotor parameters Rotor diameter: 126 m Max tip speed: 80m/s Rated rotor speed: 12,1 rpm Rated wind speed: 11,4 m/s
Length of hydraulic line More oil in the system leads to higher fluid inertia Max pressure overshoots: 10 m: 1% 20 m: 2% 50 m: 20% 100m: 40% Step inputs are not realistic! but they are useful to indicate the system performance
Hydraulic motor volumetric efficiency Oil internal leakages introduce damping: Max pressure overshoot: Efficient hydraulic motor 50% Inefficient hydraulic motor 30% Using long hydraulic line (100 m) Step inputs are not realistic! but they are useful to indicate the system performance
Rotor mass moment of inertia Inertias representative for a rotor 10 times lighter (light grey) / heavier (black) Comparison of inertias in terms of rotor diameter 80m- 2MW 126m- 5MW 200m-12,5MW Hub height wind speed of 8 m/s 17.67% TI
Summary • A fluid power transmission model and control is presented for variable speed turbines (details are found in full paper). • Friction losses are minor for laminar flow • Long hydraulic lines are prone to higher pressure fluctuations with the proposed control strategy • Minor damping provided by low volumetric efficiency of the motor • Higher inertias lead to slower and smoother response
Generator platform Outlook for fluid power transmissions • First prototypes of multi-MW wind turbines with fluid power transmission are being built/tested • Research at TUDelft: • Centralized electricity generation through fluid power transmission • Energy storage opportunities using hydraulic transmission • Opportunities for water hydraulics Passive speed control of 1.8m rotor @ OJF MicroDOT 10kW demonstrator @ TU Delft
Capital expenditure Estimations of the impact of fluid power drivetrains • CAPEX €/kW -> 24% steel reduction in tower and foundation -> 7,7% CAPEX reduction -> Elimination of power electronics -> 2,9% CAPEX reduction -> Turbine installation cost reduction of 10% -> 0,9% CAPEX reduction Overall CAPEX reduction: 11,5% Arapogianni A, Moccia J. “Economics of Wind Energy”, Modern Energy Review, Vol. 4-2, 2012, pp. 22-28.
Operational expenditure Estimations of the impact of fluid power drivetrains • OPEX €/kWh -> Maintenance (service and spare parts) cost reduction of 30% Overall OPEX reduction: 11,7% Arapogianni A, Moccia J. “Economics of Wind Energy”, Modern Energy Review, Vol. 4-2, 2012, pp. 22-28.
Annual energy production Estimations of the impact of fluid power drivetrains • AEP kWh/year -> Using a 5 MW rotor (NREL reference turbine) -> 10 m/s average wind speed in the North Sea -> Same availability as reference turbine -> Capacity factor of 0,32-0,33 (reference of 0,35) Overall energy production reduction: 4,7 to 8,6%
Cost of energy for multi-MW wind turbines Estimations of the impact of fluid power drivetrains • Levelised Cost of Energy Reference value for offshore wind is 89,62 €/MWh -> Standard hydraulic motor (90% vol efficiency, reference): Capacity factor of 0,32 83,15 €/MWh ->7,2% cost reduction -> High efficiency hydraulic motor (95% volefficiency, likely): Capacity factor of 0,33 80,46 €/MWh->10,2% cost reduction -> Same energy production as reference: Capacity factor of 0,35 77,5 €/MWh->13,5% cost reduction European Wind Energy Association “Online Electricity Cost Calculator”, Available at: www.ewea.org/index.php?id=201 (accessed December 2012)
Thankyouforyour attention! Questions?
Block diagram of dynamic system Detailed models are described in full paper
Pipelines dynamics Distributed parameter model • Dissipative model • Includes unsteady friction viscous effects • Better description of transient behavior • Reduced order models ideal for time-domain simulations • Based on the work of Makinen[1] Blocked line response to pressure step input; Dissipation number Dn=0,01 [1] Makinen J, Piché R, Ellman. “A Fluid TransmissionLine Modeling Using a Variational Method”, ASME Journal of Dynamic Systems Measurement and Control, Vol. 122, 2000, pp. 153-162.
Variable speed control strategy Minimum rotor speed no longer limited by generator Transition region, similar to geared solution NREL 5MW rotor parameters Rated pressure: 350 bar (15 bar charge pressure) Max tip speed: 80m/s Rated rotor speed: 12,1 rpm Urated: 11,4 m/s Pressure PI control loop with outer speed feedback
Transmission efficiency[2] [2] Jarquin Laguna A, Diepeveen N. “The Rise of Fluid Power Transmission Systems for Wind Turbines ”, Modern Energy Review, 2012, Vol. 4-2, pp. 64-68,.
NREL Cp –Ct lambda curve Max Cp= 0,485 @ lambda=7,55 pitch=0 deg