Download
1 / 36
360 likes | 467 Views
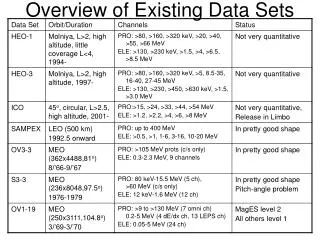
Overview of existing resource tracking efforts, methodologies and findings. Teresa Guthrie Centre for Economic Governance and AIDS in Africa. Presentation outline. Why track budgets and expenditure?? Some definitions Existing efforts Findings and limitations Gaps in the information

E N D
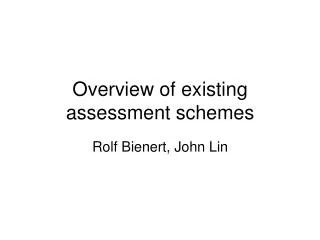
Overview of existing resource tracking efforts, methodologies and findings Teresa Guthrie Centre for Economic Governance and AIDS in Africa
Presentation outline • Why track budgets and expenditure?? • Some definitions • Existing efforts • Findings and limitations • Gaps in the information • Harmonisation of approaches • Conclusion
Why do government budgets matter? • Govt is powerful actor innational economy so how it spends its money and how it raises money is a large determinant of health of the economy • Govt revenue and expenditure plans can potentially have powerful redistributive and developmental impact • Relative openness of budget processes and systems are key indicator or influence on degree or nature of democracy in the country
Why track budgets? • Fundamental tool in implementation of public policy • sets out the allocation of public resources. • More telling indicator of the priority accorded to health (or any issue) than policy or legislation • National budget is key to sustainability of any government programme • Informed budgets and funding mechanisms for health therefore enhance ability of governments to plan and implement health interventions effectively.
Using budget analysis as a resource-tracking tool • Adequacy: How much is budgeted? Vs Need? • Priority: How does the budget for this purpose compare to resources spent in other areas? • Progress: Is government’s response on this issue improving? • Equity: Are resources being allocated fairly?
Uses of Resource Tracking • Resource tracking identifies and measures: • All sources of funds – public, private and external • Providers of services (recipients of funds, public & private) • Actual expenditure on all services • Beneficiaries and outputs • Identification of what resources are available, so as to ascertain the resource gap • Mobilizing more resources to fill gaps • Allocative efficiency measurement • To measure trends over time – changing priorities. • Informs policy decisions
Uses of Resource Tracking cont. • Advocacy – evidence = power! • Addressing equity of access to services • Distinguish between Real Aid and Phantom Aid • To monitor issues of additionality of financial and human resources • To identify absorption capacity problems and bottlenecks
Budget Monitoring, Expenditure Analysis and Resource Tracking Assessment of Resource Need – costing analysis Budget Monitoring Process Actual amounts Revenue & tax Sector analysis Budget Allocations – indication of intended PUBLIC expenditure Your use of the data will influence all these aspects Outcome analysis – long-term indicators. Impact assessment Public Private Donor Actual Expenditure – execution of budget. Can include all sources of funds and by all service providers Life years saved Quality of life Reduced prevalence rates Causal link Effectiveness (CEA/CBA/CUA) Expenditure Analysis Process/finance channels Actual amounts Output analysis – interim indicators comparing with objectives of expenditure Outputs Efficiency Effectiveness Quality
Linking Resource Need Estimates to Allocation analysis toExpenditure Estimates How much was spent How much was allocated How much is needed • Through government • Public • Foreign • Private • In strategic programs • Targeted IEC • Condoms • PMTCT • STI treatment • VTC • ARV treatment • IO treatment • Palliative services • Social Impact Mitigation • Staff training • Research • Through private orgs/NGOs • At global level • At national level • MOH • Other ministries • NGO, CSO, CBO • At province level • Tertiary, Secondary • Primary level • NGO, CSO, CBO • At local level • In strategic programs • Based on need (idealistically?) • Currently covered (reality?) • Financial / Programmatic gaps
Existing Health & HIV/AIDS Resource Tracking Efforts • National Health Accounts (WHO NHAs) – sub-analysis on HIV/AIDS expenditure • Budget analysis studies of allocations – AIDS Budget Unit, FUNDAR, IBP, ActionAid, ELBAG, CSPR group, many civil society groups • OECD-DAC data base and NIDI Resource Flows Project for HIV/AIDS & reproductive health – donor assistance only • National AIDS Accounts (Stand alone NAAs) – only HIV/AIDS expenditure - SIDALAC • National AIDS Spending Assessments (NASAs) - only HIV/AIDS expenditure - UNAIDS
Development aid for HIV/AIDS: How much is going to which countries? 100 4.5 91.2 4.1 Total million USD 90 4 2000-2002 80 3.5 Per capita USD 2000-2002 70 3 60 2.5 2.2 Total million USD Per capita USD 50 2 40 1.5 28.6 30 1 20 0.8 0.7 0.5 10 0 0 Kenya Ghana Nigeria Zambia Uganda Ethiopia Tanzania Zimbabwe South Africa Mozambique Source: OECD/UNAIDS special study: Aid Activities in Support of HIV/AIDS Control for 2000-2002.
Civil Society groups supported to undertake Health and HIV/AIDS Resource Tracking in Africa CEGAA works with UNAIDS, OSI and ActionAid in numerous African, East European and Asian countries. International Budget Project supports budget advocacy throughout the world.
Are African states meeting the Abuja declaration? (Public Health as share of total expenditure) 18% Mozambique 16% Abuja target 14% Namibia - Total for MoHSS 12% South Africa 10% Namibia – Health specific 8% Kenya 6% 4% 2% 0% 2000/1 2001/2 2002/3 2003/4 2004/5 2005/6 Source: Guthrie & Hickey, 2004. ABU, Idasa.
Africa ~ HIV/AIDS allocations as share of total health expenditure 18% South Africa 16% Mozambique 14% Kenya 12% 10% 8% 6% 4% 2% 0% 2000/1 2001/2 2002/3 2003/4 2004/5 2005/6 Source: Guthrie & Hickey, 2004. ABU, Idasa.
Other (pvt, NGOs, CBOs, FBOs) Total HIV/AIDS Expenditure in Kenya by Source (2000/01-2005/06) 14,000,000 12,000,000 10,000,000 8,000,000 Kshs 6,000,000 4,000,000 2,000,000 0 2002/03 2004/05 2000/01 2003/04 2001/02 2005/06* Public Sector (government & Bilateral/ Multilateral/NGOs Source: Kioko in Guthrie & Hickey, 2004. National Aids Resource Envelope, 2003. donors)
South Africa – HIV/AIDS allocations by sector Dept. of Public Service & Admin. and Dept. of Science & Tech. Social Development: HIV/AIDS Programme (including condtl grants) Education: HIV/AIDS condtl grant Health: HIV/AIDS and TB Sub- programme includes condtl grant 2,500 2,000 1,500 R million (nominal) 1,000 500 0 2000/1 2001/2 2002/3 2003/4 2004/5 2005/6 2006/7 NB: Does not include funds from provinces' own budgets. Source: Guthrie & Hickey, 2004. ABU, Idasa.
Challenges/ limitations of the budget studies • General Budget challenges: • Inaccessibility and unavailability of budget data (for budgets generally and HIV/AIDS specifically) • Previously centralised governments – access difficult & general lack of CSO participation. • Little disaggregation in budget documents. • Recorded budget allocations are rarely the actual expenditure & audited figures not easily available. • Varying budgetary and accounting systems – undermines comparability between countries.
Challenges cont. • Issues specific to HIV and Aids: • Lack of HIV/AIDS specific line-item in formal budget documents. • Lack of standardized classifications and definitions. • Global interest in donor allocations to HIV and Aids (mostly not indicated on budget) • Countries lack central database of donor funds. • Desk review alone of formal budget documents is insufficient to obtain adequate data – estimates of expenditure required.
Challenges cont. • Methodological issues: • Budget allocation analysis insufficient – need expenditure estimates, and output analysis. • Limited analysis of the services provided (nothing on target groups). • Demand not only for budget allocations, but to also identify outputs and assess the impact of expenditure. • No district level analysis – but demanded by NGOs.
NASA identifies and measures funds from three main financing sources: • Foreign or international or external • IFIs, bilateral, multilateral, intl corporations, intl NGOs, Rest-of-World households • Public • Central government, sub-national government, social security • Private • Households, out-of-pocket expenditure (OOPE), NGOs, insurance Globally, bilateral donors and multilateral agencies are the largest funding streams, although the size of these streams varies significantly by region.
Source Provider Functions A C B Budgetary Items Target Groups Flow of resources from origin to end users: reconstruction of transactions Non Specific
Private Contributions to HIV/AIDS – PLWHAs carry a large share • Burkina Faso - households contribute 14% of the total expenditure on AIDS - primarily used for traditional healers (70%) and purchasing pharmaceuticals (29%) (NAA, 2003). • Zambia – HH contributed 29% of expenditures through out-of-pocket spending. Government = 17%. Donors and cooperating partners = 46% (NHA, 2002). • Rwanda - HH contributed 16% of expenditures through out-of-pocket spending. Government = 8%. Donors and cooperating partners = 75% (NHA, 2002).
PPP$ 15 Zambia Ghana PPP$12 Burkina Faso PPP$10 Kenya PPP$ 8.12 Rwanda PPP$ 7.79 Honduras Uruguay Argentina Q4 Haiti Costa Rica Nicaragua Panamá Q3 Brasil Perú R Dominicana Q2 El Salvador Paraguay Chile México Q1 Guatemala Bolivia 0.00 2.00 4.00 6.00 8.00 10.00 12.00 NAAs ~ HIV/AIDS per capita expenditures LAC and selected African countries. PPP-USD$, 2002/3. (Pre-GF)
Donor Private Public NHAs – Analysis of Sources of Expenditure on Health 100% 90% 80% 70% 60% 50% Percent of total health expenditure 40% 30% 20% 10% 0% LAC Kenya Malawi Zambia Ethiopia MENA Uganda Rwanda Tanzania Zimbabwe Mozambique South Africa Source: Nandakumar, A.K., Bhawalkar, et al. 2004. Synthesis of Findings from NHA Studies in Twenty-Six Countries. PHR+ Project.
Gaps in the existing information • Local government expenditure (district level) • Comprehensive databases of external sources (at international and national levels) • Limited disaggregation by function (service provided) • Limited: indirect /out-patient / Home-Based Care • Limited household expenditure (different methods) • Limited disaggregation by gender and age • Limited analysis of expenditure on non-health HIV/AIDS activities • Outputs and outcomes – assessment of quality of goods and services production level, not only resource consumption level • Challenge – standardizing classifications and definitions – to ensure cross-country comparison
Expanding & harmonising approaches • Necessary for cross-country comparisons and international acceptance of findings • Therefore approaches should: • Provide an inventory of ALL resources for health or HIV/AIDS ~ public, private, international ~ (allocated budgets and actual expenditures) OR select one or more and undertake comprehensively • Standardised definitions and classifications for all the functions and categories – suggest using NHA (for health) and NASA (for HIV/AIDS) guidelines • Provide internationally comparable reports - the breakdown of tables, the content of categories and the methods of calculation must be harmonized & internally consistent
Expanding & harmonising cont. • Tracking all transactions and all services provided, down to district level (where feasible). • Identification of the beneficiary groups of all services provided. • UNAIDS suggests that the methods should be compatible with the SNA /NHA / NASA systems developed over the last 30 years. • Measurement of actual outputs and outcomes, and effectiveness analysis where possible. • Broadening the network of countries and organisations involved in health and HIV/AIDS resource tracking globally.
Conclusion • Attention on improving economic governance, accountability, transparency, challenging the size of the pie to health and HIV/AIDS. • Increasing efforts by governments and civil society to track the resources flowing to health and HIV/AIDS and their utilization. • Financial management and reporting systems are poor, and formal budget figures are insufficient to give the whole picture, therefore investigative research and mobilisation required! • The power is where the money is!
Thank you! • For more information contact: • Teresa Guthrie • Centre for Economic Governance and AIDS in Africa • Email: teresa@cegaa.org • guthrieteresa@yahoo.com • Tel: +27-82-872-4694 • Fax: +27-88-021-425-2852