Download
1 / 1
10 likes | 82 Views
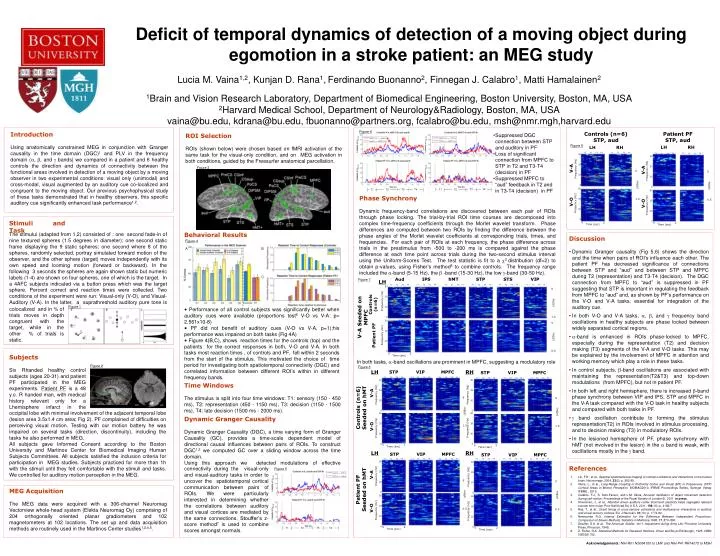
LH. RH. STP. VIP. MPFC. STP. VIP. MPFC. T1. T4. T1. T4. T1. T4. T2. T3. T2. T3. T2. T3. T1. T4. T1. T4. T1. T4. T2. T3. T2. T3. T2. T3. V-A. Controls (n=6) STP, aud. Patient PF STP, aud. Controls (n=6) Seeded on hMT. LH. RH. LH. RH. T3. T3. T3. T4. T4.

E N D
LH RH STP VIP MPFC STP VIP MPFC T1 T4 T1 T4 T1 T4 T2 T3 T2 T3 T2 T3 T1 T4 T1 T4 T1 T4 T2 T3 T2 T3 T2 T3 V-A Controls (n=6) STP, aud Patient PF STP, aud Controls (n=6) Seeded on hMT LH RH LH RH T3 T3 T3 T4 T4 T4 T1 T1 T1 T2 T2 T2 T1 T4 T1 T4 T2 T3 T2 T3 T1 T4 T1 T4 T2 T3 T2 T3 V-O V-A V-A LH RH STP VIP MPFC STP VIP MPFC T1 T4 T1 T4 T1 T4 T1 T4 T1 T4 T1 T4 T2 T3 T2 T3 T2 T3 T2 T3 T2 T3 T2 T3 V-O V-O V-A Patient PF Seeded on hMT Aud IPS hMT STP STS VIP T1 T4 T1 T4 T1 T4 T1 T4 T1 T4 T1 T4 T2 T3 T2 T3 T2 T3 T2 T3 T2 T3 T2 T3 V-O 50 50 50 50 50 50 50 50 50 50 50 50 50 50 Controls (n=6) 35 35 35 35 35 35 35 35 35 35 35 35 35 35 Frequency (Hz) Frequency (Hz) Frequency (Hz) Frequency (Hz) Frequency (Hz) Frequency (Hz) Frequency (Hz) Frequency (Hz) Frequency (Hz) Frequency (Hz) Frequency (Hz) Frequency (Hz) Frequency (Hz) Frequency (Hz) V-A Seeded on MPFC 5 6 6 5 6 5 6 5 20 20 20 20 20 20 20 20 20 20 20 20 20 20 5 5 5 5 5 5 5 5 5 5 5 5 5 5 -log(p) -log(p) -log(p) -log(p) -log(p) -log(p) -log(p) -log(p) Patient PF 1.5 1.5 0.5 0.5 1.5 1.5 0.5 0.5 0 0 0 0 0 0 0 2 2 2 2 2 2 2 Time (sec) Time (sec) Time (sec) Time (sec) Time (sec) Time (sec) Time (sec) A B C LH Deficit of temporal dynamics of detection of a moving object during egomotion in a stroke patient: an MEG study Lucia M. Vaina1,2, Kunjan D. Rana1,Ferdinando Buonanno2, Finnegan J. Calabro1, Matti Hamalainen2 1Brain and Vision Research Laboratory, Department of Biomedical Engineering, Boston University, Boston, MA, USA2Harvard Medical School, Department of Neurology&Radiology, Boston, MA, USA vaina@bu.edu, kdrana@bu.edu, fbuonanno@partners.org, fcalabro@bu.edu, msh@nmr.mgh,harvard.edu Figure 6 Introduction Using anatomically constrained MEG in conjunction with Granger causality in the time domain (DGC)1 and PLV in the frequency domain (, , and bands) we compared in a patient and 6 healthy controls the direction and dynamics of connectivity between the functional areas involved in detection of a moving object by a moving observer in two experimental conditions: visual only (unimodal) and cross-modal, visual augmented by an auditory cue co-localized and congruent to the moving object. Our previous psychophysical study of these tasks demonstrated that in healthy observers, this specific auditory cue significantly enhanced task performance1,2. ROI Selection ROIs (shown below) were chosen based on fMRI activation of the same task for the visual-only condition, and on MEG activation in both conditions, guided by the Freesurfer anatomical parcellation. • Suppressed DGC connection between STP and auditory in PF • Loss of significant connection from MPFC to STP in T2 and T3-T4 (decision) in PF • Suppressed MPFC to “aud” feedback in T2 and in T3-T4 (decision) in PF Figure 9 Figure 3 Phase Synchrony Dynamic frequency-band correlations are discovered between each pair of ROIs through phase locking. The trial-by-trial ROI time courses are decomposed into complex time-frequency coefficients through the Morlet wavelet transform. Phase differences are computed between two ROIs by finding the difference between the phase angles of the Morlet wavelet coefficients at corresponding trials, times, and frequencies. For each pair of ROIs at each frequency, the phase difference across trials in the prestimulus from -500 to -200 ms is compared against the phase difference at each time point across trials during the two-second stimulus interval using the Uniform-Scores Test. The test statistic is fit to a 2 distribution (df=2) to obtain p-values, using Fisher’s method8 to combine controls. The frequency range included the -band (5-15 Hz), the -band (15-30 Hz), the low -band (30-50 Hz). Stimuli and Task The stimului (adapted from 1,2) consisted of : one second fade-in of nine textured spheres (1.5 degrees in diameter); one second static frame displaying the 9 static spheres; one second where 8 of the spheres, randomly selected, portray simulated forward motion of the observer, and the other sphere (target) moves independently with its own speed and looming motion (forward or backward). In the following 3 seconds the spheres are again shown static but numeric labels (1-4) are shown on four spheres, one of which is the target. In a 4AFC subjects indicated via a button press which was the target sphere. Percent correct and reaction times were collected. Two conditions of the experiment were run: Visual-only (V-O), and Visual-Auditory (V-A). In the latter, a suprathreshold auditory pure tone is colocalized and in % of trials moves in depth congruent with the target, while in the other % of trials is static. Behavioral Results • Performance of all control subjects was significantly better when auditory cues were available (proportions test6 V-O vs V-A: p= 2.561x10⁻⁸) • PF did not benefit of auditory cues (V-O vs V-A, p=1);his performance was impaired on both tasks (Fig 4A) • Figure 4(B,C), shows reaction times for the controls (top) and the patients for the correct responses in both, V-O and V-A. In both tasks most reaction times , of controls and PF, fell within 2 seconds from the start of the stimulus. This motivated the choice of time period for investigating both spatiotemporal connectivity (DGC) and correlated information between different ROI’s within in different frequency bands. • Discussion • Dynamic Granger causality (Fig 5,6) shows the direction and the time when pairs of ROI’s influence each other. The patient PF has decreased significance of connections between STP and “aud” and between STP and MPFC during T2 (representation) and T3-T4 (decision). The DGC connection from MPFC to “aud” is suppressed in PF suggesting that STP is important in regulating the feedback from MPFC to “aud” and, as shown by PF’s performance on the V-O and V-A tasks, essential for integration of the auditory cue. • In both V-O and V-A tasks, , , and frequency band oscillations in healthy subjects are phase locked between widely separated cortical regions. • -band is enhanced in ROIs phase-locked to MPFC, especially during the representation (T2) and decision making (T3) segments of the V-A and V-O tasks. This may be explained by the involvement of MPFC in attention and working memory which play a role in these tasks. • In control subjects, -band oscillations are associated with maintaining the representation(T2&T3) and top-down modulations (from MPFC), but not in patient PF. • In both left and right hemisphere, there is increased -band phase synchrony between VIP and IPS, STP and MPFC in the V-A task compared with the V-O task in healthy subjects and compared with both tasks in PF. • band oscillation contribute to forming the stimulus representation(T2) in ROIs involved in stimulus processing, and to decision making (T3) in modulatory ROIs. • In the lesioned hemisphere of PF, phase synchrony with hMT (not involved in the lesion) in the band is weak, with oscillations mostly in the band. Figure 4 Figure 7 Figure 1 colocalized and in % of trials moves in depth congruent with the target, while in the other % of trials is static. Subjects Six Rhanded healthy control subjects (ages 20-31) and patient PF participated in the MEG experiments. Patient PF is a 48 y.o. R handed man, with medical history relevant only for a Lhemisphere infarct in the occipital In both tasks, -band oscillations are prominent in MPFC, suggesting a modulatory role Figure 2 Figure 8 Time Windows The stimulus is split into four time windows: T1: sensory (150 - 450 ms), T2: representation (450 - 1150 ms), T3: decision (1150 - 1500 ms), T4: late decision (1500 ms - 2000 ms). occipital lobe with minimal involvement of the adjacent temporal lobe (lesion area 3.5x1.4 cm area; Fig 2). PF complained of difficulties on perceiving visual motion. Testing with our motion battery he was impaired on several tasks (direction, discontinuity), including the tasks he also performed in MEG. All subjects gave Informed Consent according to the Boston University and Martinos Center for Biomedical Imaging Human Subjects Committees. All subjects satisfied the inclusion criteria for participation in MEG studies. Subjects practiced for more than 1h with the stimuli until they felt comfortable with the stimuli and tasks. We controlled for auditory motion perception in the MEG. Dynamic Granger Causality Dynamic Granger Causality (DGC), a time varying form of Granger Causality (GC), provides a time-scale dependent model of directional causal influences between pairs of ROIs. To construct DGC1,2 we computed GC over a sliding window across the time domain. Using this approach we detected modulations of effective connectivity References Figure 5 connectivity during the visual-only and visual-auditory tasks in order to uncover the spatiotemporal cortical communication between pairs of ROIs. We were particularly interested in determining whether the correlations between auditory and visual cortices are mediated by the same connections. Stouffer’s z-score method7 is used to combine scores amongst normals. 1. Lin, F.H., et al., Spectral spatiotemporal imaging of cortical oscillations and interactions in the human brain. Neuroimage, 2004. 23(2): p. 582-95. 2. Vaina, L., et al., Long-Range Coupling of Prefrontal Cortex and Visual (MT) or Polysensory (STP) Cortical Areas in Motion Perception. BIOMAG2010, IFBME Proceedings Series, Springer Verlag IFBME., 2010. 3. Calabro, F.J., S. Soto-Faraco, and L.M. Vaina, Acoustic facilitation of object movement detection during self-motion. Proceedings of the Royal Society of London B., 2011. in press. 4. Ahveninen, J., et al., Attention-driven auditory cortex short-term plasticity helps segregate relevant sounds from noise. Proc Natl Acad Sci U S A, 2011. 108(10): p. 4182-7. 5. Raij, T., et al., Onset timing of cross-sensory activations and multisensory interactions in auditory and visual sensory cortices. Eur J Neurosci. 31(10): p. 1772-82. Newcombe R.G. Interval Estimation for the Difference Between Independent Proportions: Comparison of Eleven Methods. Statistics in Medicine,1998. 17, 873–890. Stouffer, S.A. et al., The American Soldier, Vol.1: Adjustment during Army Life. Princeton University Press, Princeton, 1949. Z. Fisher, R.A. Statistical Methods for Research Workers. Oliver and Boyd (Edinburgh), 1925. ISBN 0050021702. MEG Acquisition The MEG data were acquired with a 306-channel Neuromag Vectorview whole-head system (Elekta Neuromag Oy) comprising of 204 orthogonally oriented planar gradiometers and 102 magnetometers at 102 locations. The set up and data acquisition methods are routinely used in the Martinos Center studies1,2,4,5. Acknowledgements: NIH-R01 NS064100 to LMV and NIH-P41 RR14075 to MSH