Download
1 / 14
140 likes | 415 Views
Correlation. Ch 17, Principle of Biostatistics Pagano & Gauvreau Prepared by Yu-Fen Li. Correlation Analysis.

E N D
Correlation Ch 17, Principle of Biostatistics Pagano & Gauvreau Prepared by Yu-Fen Li
Correlation Analysis • When we investigate the relationships that can exist among continuous variables, one statistical technique often employed to measure such an association is known as correlation analysis. • Correlation is defined as the quantification of the degree to which two random variables are related, provided that the relationship is linear
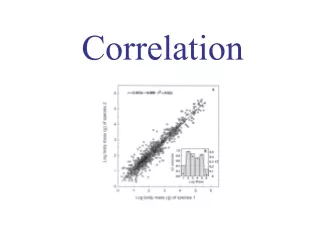
Two-way scatter plot • Before we conduct the analysis, we should always create a two-way scatter plot of the data • Not surprisingly, the mortality rate tens to decreases as the percentage of children immunized increases
Pearson’s Correlation Coefficient • Pearson’s coefficient of correlation, or simply the correlation coefficient • The correlation quantifies the strength of the linear relationship between the outcomes x and y
Correlation Coefficient r • dimensionless, −1 ≤ r ≤ 1
Example Please note that the correlation coefficient only tells us that a linear relationship exists between two variables; it does not specify whether the relationship is cause-and-effect
Hypothesis Testing • We would like to draw conclusions about the unknown population correlation ρ using the sample correlation coefficient r
One-Sample Z-Test for Correlation Coefficient • Sometimes the correlation between two random variables are expected to be some quantity ρ0 other than zero
Limitations of Coefficient of Correlation 1) r quantifies only the strength of the linear relationship, 2) r is highly sensitive to extreme values, 3) the estimated correlation should never be extrapolated beyond the observed ranges of the variables, 4) a high correlation between two variables does not imply a cause-and-effect relationship.
Spearman’s Rank Correlation Coefficient • Pearson’s coefficient of correlation is very sensitive to outlying values • Spearman’s rank correlation coefficient is simply Pearson’s correlation coefficient r calculated for the ranked values of x and y where diis the difference between the rank of xi and the rank of yi
Hypothesis Testing • If the sample size n is not too small (n ≥ 10), we can test • This testing procedure does not require that X and Y be normally distributed
Hypothesis Testing We reject H0 at the 0.05 level and conclude that the true population correlation is different from 0.
Pros and Cons • Spearman’s rank correlation coefficient has some advantages and disadvantages • much less sensitive to extreme values • can be used when one or both of the variables are ordinal • it does not use everything than is known about a distribution, since it relies on ranks rather than actual observations