Download
1 / 11
110 likes | 282 Views
Ishikawa Diagram rachelle lardizaba l precy mata neil justine abad ryan macabeo. Ishikawa diagrams. also called fishbone diagrams , cause-and-effect diagrams or Fishikawa are causal diagrams that show the causes of a certain event

E N D
Ishikawa Diagramrachellelardizabalprecy mataneiljustineabadryanmacabeo
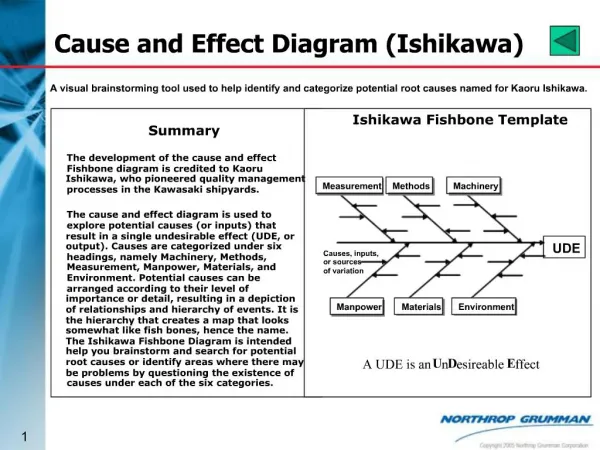
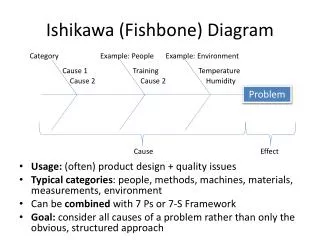
Ishikawa diagrams • also called fishbone diagrams, cause-and-effect diagrams orFishikawa • are causal diagrams that show the causes of a certain event • was developed by Kaoru Ishikawa during the 1960s as a way of measuring quality control processes in the shipbuilding industry. • Also referred to as a "fish bone diagram" or "cause-and-effect diagram". • The purpose of the Ishikawa diagram is to allow management to determine which issues have to be addressed in order to gain or avoid a particular event.
Common uses of the Ishikawa diagram are: (1)product designand ; (2)quality defect prevention, = to identify potential factors causing an overall effect. Each cause or reason for imperfection is a source of variation. Causes are usually grouped into major categories to identify these sources of variation.
The categories typically include: • People: Anyone involved with the process • Methods: How the process is performed and the specific requirements for doing it. • Machines: It required to accomplish a job • Materials: Used to produce the final product • Measurements: Data generated from the process that are used to evaluate its quality • Environment: The conditions in which the process operates.
What is a Cause-and-Effect Diagram? • is an analysis tool that provides a systematic way of looking at effects and the causes that create or contribute to those effects. • a tool that is useful for identifying for identifying and organizing the known or possible causes of quality, or the lack of it. The structure provided by the diagram helps team members think in a very systematic way.
When should a team use a Cause-and-Effect Diagram? • Identify the possible root causes, the basic reasons, for a specific effect, problem, or condition. • Sort out and relate some of the interactions among the factors affecting a particular process or effect. • Analyze existing problems so that corrective action can be taken.
Benefits of constructing a Cause-and-Effect Diagram • Helps determine the root causes of a problem or quality characteristic using a structured approach. • Encourages group participation and utilizes group knowledge of the process. • Uses an orderly, easy-to-read format to diagram cause-and-effect relationships. • Indicates possible causes of variation in a process. • Increases knowledge of the process by helping everyone to learn more about the factors at work and how they relate. • Identifies areas where data should be collected for further study.
How do we develop a Cause-and-Effect Diagram? • Step 1: Identify and clearly define the outcome or EFFECT to be analyzed. • Step 2: Using chart pack positioned so that everyone can see it, draw the SPINE and create the EFFECT box. • Step 3: Identify the main CAUSES contributing to the effect being studied. • Step 4: For each major branch, identify other specific factors which may be the CAUSES of the EFFECT. • Step 5: Identify increasingly more detailed levels of causes and continue organizing them under related causes or categories. You can do this by asking a series of why questions. • Step 6: Analyze the diagram.