Download
1 / 24
240 likes | 374 Views
The Interplay Between the Statistical Correlations of g -ray Emission Probabilities and Efficiency Calibration *. Ruy M. Castro 1,2 , Vito R. Vanin 3 , Paulo R. Pascholati 3 , Nora L. Maidana 3 1 IEAv - CTA, São José dos Campos, Brasil 2 DMAF - UNITAU, Taubaté, Brasil

E N D
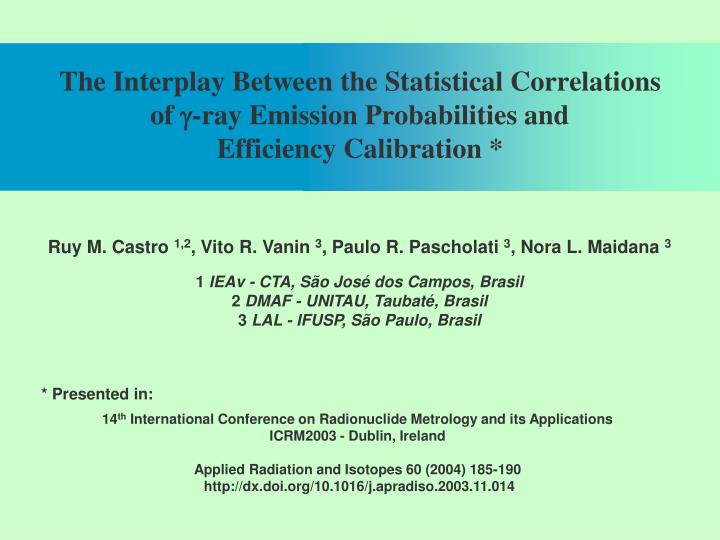
The Interplay Between the Statistical Correlationsof g-ray Emission Probabilities and Efficiency Calibration * Ruy M. Castro 1,2, Vito R. Vanin 3, Paulo R. Pascholati 3, Nora L. Maidana 3 1 IEAv - CTA, São José dos Campos, Brasil 2 DMAF - UNITAU, Taubaté, Brasil 3 LAL - IFUSP, São Paulo, Brasil * Presented in: 14th International Conference on Radionuclide Metrology and its Applications ICRM2003 - Dublin, Ireland Applied Radiation and Isotopes 60 (2004) 185-190 http://dx.doi.org/10.1016/j.apradiso.2003.11.014
Contents • Are the data correlated? • Efficiency Calibration • Example • Decay parameters
Are the data correlated? Analyzing the 152Eu published data ~ 32 experiments with the most intense transitions
Are the data correlated? r = 0.6
Are the data correlated? Some other cases:
Are the data correlated? Efficiency • e- Efficiency • Area- Peak area • F- Factor • Activity • Normalization Constant • Reference area • Pg- Emission probability • Usually: • Area, F and P are independent • Area is uncorrelated • Pg are correlated for a multi gamma source, • but their correlation coefficients are generally unknown
Efficiency Calibration Typical efficiency curve For energies above 150-200 keV Eg– Gamma Energy Eb– Reference Energy
Efficiency Calibration For example: Using a Matrix notation:
Efficiency Calibration Fitting Procedure Problem: How to obtain V? What is V? Variance in Y due to: peak area, factor and emission probability
Efficiency Calibration Variance in Y due to Area: VY-Area
Efficiency Calibration Variance in Y due to F: VY-F
Efficiency Calibration Variance in Y due to Pg: VY-Pg
Efficiency Calibration Fitting Procedure Quality of the fitting: Interpolation:
Example Typical efficiency calibration • 1 multi gamma-ray source - 152Eu • (partially know covariance) • 2 105 Bq Activity • 20 cm source-detector distance • 2 h of measurement (live time) • Pile-up rejection and dead time correction Relative efficiency
Example Efficiency curve
Example Calibration Data
Example Variance Matrix
Example Results: With covariances Without covariances a0 = 0,157(4) a1 = -0,796(4) a0 = 0,1537(23) a1 = -0,800(4) r = 0,55 r = 0,54
Example Results: Uncertainties
Decay parameters Decay Scheme Peak Areas + corrections Pg and corrections dependents of the decay parameters
Decay parameters Decay Scheme Constraints Probability & area
Conclusion • The emission probabilities of a multi gamma source are correlated • The emission probabilities and efficiencies are dependents. • Should use branching ratios and feeding fractions instead of gamma intensities.
References • Ruy M. Castro , Vito R. Vanin , Otaviano Helene , Paulo R. Pascholati , Nora L. Maidana , Mauro S. Dias and Marina F. Koskinas,The Interplay Between the Statistical Correlations of g-ray Emission Probabilities and Efficiency Calibration, Applied Radiation and Isotopes 60 (2004) 185-190 • http://dx.doi.org/10.1016/j.apradiso.2003.11.014 • Vito R. Vanin and Otaviano Helene, Covariance Analysis Within the Framework of the Least-squares Methodin Update of X Ray and Gamma Ray Data Standards for Detector Calibration and Other applications, International Atomic Energy Agency, Viena (2007)