Download
1 / 17
170 likes | 263 Views
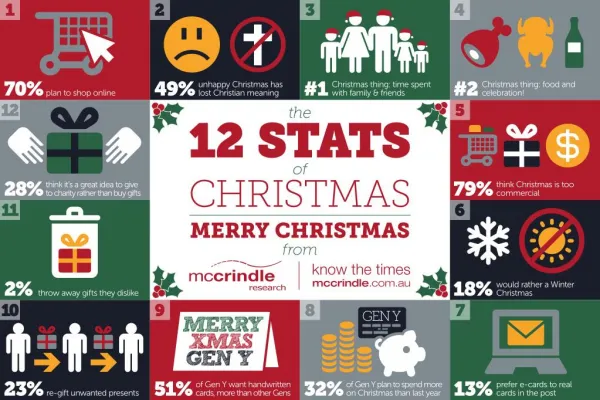
12 Stats. Statistics is a body of methods for making wise decisions in the face of uncertainty. W. Allen Wallis.

E N D
12 Stats Statistics is a body of methods for making wise decisions in the face of uncertainty. W. Allen Wallis
This course has been designed forstudents who wish to keep their career options open by studying mathematics at Level 2, for whom the regular course in mathematics is not appropriate. Successful completion of the course provides eligibility for continuing with a Statistics and Modelling course in year 13. WHY TAKE STATISTICS? We live a world that is filled with uncertainty and variability. The field of statistics exists because of this. Statistical methods allow us to gain information and control because we can use them to measure variability and find predictable patterns in the presence of uncertainty. Here are some reasons why statistical methods are popular and useful: As individuals to help us make personal decisions about things like What to eat to remain healthy How to enhance our children’s well-being Which treatment to undergo in a medical situation How to invest our time to enhance our enjoyment of life As a society we want to have some control over Reducing rates of cancer, heart attack, diabetes and other diseases Growing better plants (pest resistant, high yield, etc) Determining public education strategies to reduce the incidence of HIV Deciding on road safety measures to reduce to road toll As intelligent and curious beings we want to understand things like Psychic abilities – are they real? Are left-handed people better at mathematics? Does listening to classical music enhance our intelligence? Do male and female brains work differently? As social and curious beings we want to know about other people Who are they planning to vote for at the next election? What TV programmes are they watching? How much alcohol do they drink? How much exercise do they take? 12 Statistics
Continuing with Statistics • A few of the students (about 2 or 3) who successfully complete the course go on to take the full 24 credit Stats and Modelling course that includes external assessment. • About 40% of them continue with an internally assessed course in Stats (see later for details).
Use of technology There is a strong technology component. Technology is used for assessment. Skills are developed with • Excel • Fathom. • Casio Power Graphic fx-9750GPLUS
Content overview • Surveys and Questionnaires • Display of Data • Sampling • Probability • Bi-variate Data or Time SeriesInvestigation • Sequences and Series • Calculus • Some elements of statistical literacy
NCEA • This course is entirely internally assessed and provides access to a maximum of 17 Level 2 credits.
Processes In addition students who achieve all students using a high level of communication will be eligible to enter Unit Standard 5243 Apply mathematical processes and skills in problems 7 Credits
Questionnaires Unit Standard 12333: 3 Credits Demonstrate understanding of, and use Questionnaire design demonstrate understanding of questionnaire design, and design and trial a questionnaire for a given purpose.
Compare Data Sets • Display of data • Box plot, (composite) bar graphs • Measures • Mean, median • Standard deviation, inter-quartile range • Comparison • Discuss symmetry • unusual values • compare box plots
Investigation Using time series or Bi-variate data • Writing a question • Construction of a scatterplot • Describe trend • Insert a linear trend line • Make a prediction
Sequences and Series • Taught and assessed using Excel
13 internally assessed statistics • Achievement Objectives • To give access to mathematics for students who wish to keep their career options open by studying mathematics at Level 3 for whom the regular course in mathematics is not appropriate • To develop skills and understanding in the application of statistics and modelling. • To use technology as an aid to solve problems involving the analyses of data. • This course has “approved subject” status.
The quiet statisticians have changed our world-not by discovering new facts or technical developments but by changing the ways that we reason, experiments and form our opinions Ian Hacking (Science 1984)