Download

1 / 12
150 likes | 405 Views
Data Envelopment Analysis. Chapter 1 Introduction - General Discussion. Mission, Vision, Goals, & Strategies: A Brief Review. Mission statement: reasons to exist Vision statement: want to be Goals: Support mission/vision statements Long/short term goals

E N D
Data Envelopment Analysis Chapter 1 Introduction - General Discussion
Mission, Vision, Goals, & Strategies:A Brief Review • Mission statement: reasons to exist • Vision statement: want to be • Goals: • Support mission/vision statements • Long/short term goals • Must be measurable, achievable, clear, … • Strategies • Ways or how to achieve goals • A big assumption behind these terms: “Performance Measurement” • Many approaches exist
1.1 Introduction • Productivity measures: Output/Input • Partial productivity measures • Ex: Sales/Labor • Increases in sales by other factors will lead to labor productivity increases even labor deteriorates • Total factor productivity measures • Must be compared to competitors/industry averages (this is the reason that productivity measures are relative: Jacobs & Chase) • Many restrictions and limited insights
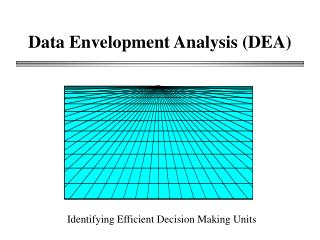
1.1 Introduction • Data envelopment analysis • A nonparametric approach • Based on the production possibility set theory (Farrell, 1957) and solved with mathematical or linear programming (Charnes, Cooper, & Rhodes, 1978) • Handles multiple inputs and outputs • Measures relative efficiency • Good for performance measurement along with benchmarking and what-if analysis Q1 - DEA model automatically finds “weights” for inputs, which are impartial. Q2 – Why “relative” efficiency? DEA compares only DMUs in the dataset. Thus, it is NOT the absolute efficiency score.
1.2 Single input & single output Efficient frontier envelops branches: why DEA
1.2 Single input & single output • Differences between DEA and regression analysis • Regression analysis shows “average” or “central tendency” • DEA identifies the frontier line for benchmarks (this line is based on the constant-returns-to-scale assumption) y = 0.622x
1.2 Single input & single output • Improving efficiency • Move “A” to “A1” (decrease the input by holding the output at the same level) or “A2” (increase output by holding the input)
1.3 Two inputs & one output case • y is normalized by dividing x1 and x2 by y respectfully for each store Unitized axes
1.3 Two inputs & one output case • Efficiency of A • Line OP divided by Line OA = 4.2855/5.0000 = 0.8571 • Improvement of Store A • Move A to A1: decrease x1 (the number of employees) or • Move A to D: decrease x2 (Area) or • Move to P or any point to the line A1D • This case is an example of an input-oriented CCR model
1.4 One input & two outputs case • Improvement “radial measures”