Download
1 / 29
290 likes | 558 Views
Linear Rights-of-Way . Revision of the Per Acre Rent Schedule for Linear Rights-of-Way Final Rule. January 2009. Statutory Authorities for Right-of-Way (ROW) Authorizations on Public Lands. Primary Statutory Authorities : Title V of the Federal Land Policy and Management Act (FLPMA)

E N D
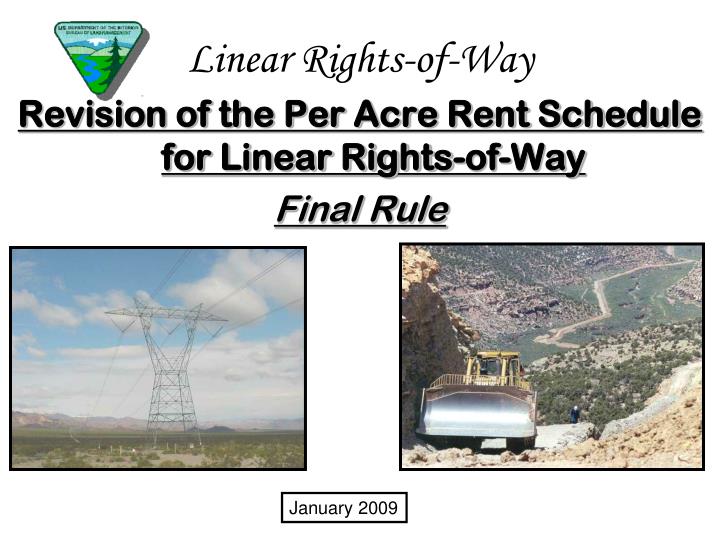
Linear Rights-of-Way Revision of the Per Acre Rent Schedule for Linear Rights-of-Way Final Rule January 2009
Statutory Authorities for Right-of-Way (ROW) Authorizations on Public Lands Primary Statutory Authorities: • Title V of the Federal Land Policy and Management Act (FLPMA) • Requires collection of FMV rent unless exempted, or waived due to hardship • Section 28 of the Mineral Leasing Act (MLA) • FMV rent – no exemptions Site Type ROW Pg 2 Linear ROW
BLM ROW Program Data • 66,000 FLPMA/Other • 30,000 MLA • 96,000 Total Grants • 48,600 Grants Subject to Rent Rent Determined by: • Linear Rent Schedule (1987) • Communication Use Rent Schedule (1995) • Appraisals Pg 3
BLM ROW Program Data • FY 2007 Rental Receipts -- $20.6 million • FLPMA rents - $16.3 million • MLA rents - $4.3 million $6.0 Million generated using existing linear rent schedules • FLPMA rental receipts distributed: 100% to the general Treasury; • MLA rental receipts distributed: 10% to the general Treasury; 40% to Reclamation fund; 50% returned to the State Government Pg 4
Linear Rent Issues • Right-of-Way rental valuations were determined by appraisals prior to 1987 • Existing linear rent schedule established in 1987 • 1995 IG Audit – BLM is under-collecting by $49 million/year in rental receipts by using schedule • Existing schedule based on outdated land values • Other rental valuation methods were hotly debated • Congressional direction – retain administrative approach based upon per acre land values • Section 367 of Energy Policy Act of 2005 Pg 5
Energy Policy Act – Section 367 • “The Secretary of the Interior shall update section 2806.20 of title 43, Code of Federal Regulations, as in effect on the date of enactment of this section…. - to revise the per acre rental fee zone value schedule by State, county, and type of linear right-of-way use, (and) - to reflect current values of land in each zone.” • “The Secretary of Agriculture shall make the same revisions for linear rights-of-way ………. on National Forest System land.” Update of Fee Schedule: Pg 6
Linear Per Acre Rent Schedule43 CFR 2806.20 Zone Rent = (zone value) X (Encumbrance Factor) X (Rate of Return) Oil & Gas Pipelines/Roads/Canals Electric Transmission/Telephone/Other Pg 7
Linear Per Acre Rent Schedule43 CFR 2806.20 Electric Transmission/Telephone/Other Oil & Gas Pipelines/Roads/Canals Encumbrance Factor (EF) = 80% Encumbrance Factor (EF) = 70% Rate of Return = 6.41% Eight Zones – Per Acre Land Values from $50 to $1,000 - includes all states/counties in lower 48 - does not apply to Alaska Annual Adjustment based on change in Implicit Price Deflator Index Pg 8
ANPR Published April 27, 2006 • “The BLM is considering using existing published information or statistical data for updating the rental schedule, such as information published by the National Agricultural Statistics Service (NASS).” • Questions: • What statistical data should be used ? • What encumbrance factor & rate of return should be used ? • What provisions should be used for large rental increases ? • Should number of zones be changed ? • Should some counties be split into more than one zone ? • Should the new schedule apply to Alaska ? • Ten comment letters received for BLM/FS consideration Pg 9
- National average Farm Real Estate value was at a historical low in 1987- National average has increased steadily since 1987- The 2002 national average represents a 102% increase over 1987’s value- The 2008 national average represents a 292% increase over 1987’s value NASS Land Values and Cash Rents - 2006 Summary 2,350 2,160 2007 2008 Pg 10
2002 NASS Census of Agriculture (Table 8 “Farms, Value of Land and Buildings”) - County-level data for all 50 states and outlying areas (PR, VI) - Average per acre county land values range from $75 to $99,000 - Published every five years (next pub. date is February 2009) - Congressionally-approved for Forest Service Org. Camp Fee schedule 1200 1127 1000 800 752 675 600 400 200 233 108 55 38 13 9 14 56 0 $1,000 $2,000 $3,000 $4,000 $5,000 $6,000 $7,000 $8,000 $9,000 $10,000 $10,001+ Per Acre Land and Building Value (2002) Distribution of Counties by 2002 Per Acre Land & Building Value Counties Pg 11
Zone brackets were chosen to capture 100% of all county land values - Zone 1 is for the 106 counties with land values under $250 per acre. - Zones 2 - 7 are for the 2,681 counties with land values between $250 and $5,000 per acre.- Zones 8 – 12 are for the remaining 293 counties with land values greater than $5,000 per acre.- Only 14 counties have per acre land values greater than $30,000. 3,080 U.S. Counties by Zone (2002) Pg 12
2002 NASS Census Per Acre Land & Building L/B and Rent Schedule Zone Pg 14
Proposed Linear Per Acre Rent Schedule All Linear Right-of-Way Facilities Zone Rent = (zone value) X (Encumbrance Factor) X (Rate of Return) Encumbrance Factor (EF) = 50% Rate of Return = 6.47% Twelve Zones – Per Acre Land Values from $250 to $100,000 - includes all states/counties, including Alaska & Hawaii Annual Adjustment based on change in Consumer Price Index Pg 15
Proposed Rule Published December 11, 2007 • The comment period on the Proposed Rule closed February 11, 2008. • Twelve Comment Letters were received. • Most commenters supported proposed rent schedule, but some recommended the following changes: • Reduce NASS Land/Building Value to eliminate value of land with buildings and irrigated cropland • Reduce 50% Encumbrance Factor • Use current rate of return • Use IPD annual index instead of CPI-U • Provide predictability • Provide multi-year phase-in period Pg 16
Final Rule Published October 31, 2008 Final Rule became effective on December 1, 2008 www.blm.gov Pg 17
BLM Response to Public Comment on Major Issues • The NASS Census Land/Building Value for each county was reduced by 20% to eliminate value of any irrigated cropland acres and/or land encumbered by buildings. • The Encumbrance Factor remains at 50%. • The rate of return was reduced from 6.47% to 5.27% to reflect most recent 10-year average in 30 Year T-Bond Yield. • The final rule increases the predictability of future rental obligations by: • establishing a 10-year schedule instead of a 1-year schedule, and by • providing one additional year of advanced notice prior to re-assigning counties each 5 year period based on new NASS Census Land/Building Values. • The final rule provides a limited, one-time phase-in period for all holders, i.e., the 2009 rental rates are reduced by 25%. Pg 18
Final Per Acre Rent Schedule All Linear Right-of-Way Facilities Zone Rent = (zone value) X (Encumbrance Factor) X (Rate of Return) Encumbrance Factor (EF) = 50% Rate of Return = 5.27% Twelve Zones – Per Acre Land Values from $250 to $100,000 - includes all states/counties, including Alaska , Hawaii, & PR Annual adjustment based on 10-year average (1994-2003) in Implicit Price Deflator Index - GDP Pg 19
2009 – 2015 Per Acre Rent Schedules • *Counties are assigned to appropriate zones for calendar years 2009-2010 based upon 2002 NASS Census Data (80% of average per acre land and building value). • **Counties are re-assigned to appropriate zones for calendar years 2011-2015 based on 2007 NASS Census Data (80% of average per acre land and building value). • Phase-In Provision: The 2009 Rental Rates have been discounted 25% for all right-of- way holders. Pg 20
2002 NASS Census Data for Nevada 80 % of Per Acre Land & Building (L/B) and Corresponding Rent Schedule Zone Pg 21
NASS Land Values and Cash Rents 2007 Summary- The 2007 national average represents an 79% increase over 2002’s value- The 2007 NASS Census will be released on February 4, 2009 Pg 22
2009 – 2015 Per Acre Rent Schedules • *Counties are assigned to appropriate zones for calendar years 2009-2010 based upon 2002 NASS Census Data (80% of average per acre land and building value). • **Counties are re-assigned to appropriate zones for calendar years 2011-2015 based on 2007 NASS Census Data (80% of average per acre land and building value). • Phase-In Provision: The 2009 Rental Rates have been discounted 25% for all right-of- way holders. Pg 23
* ** *** **** *Current Year Receipts using old rental rates **Projected Rental Receipts using new rental rates with phase-in ***Projected Rental Receipts using new rental rates – no phase-in ****Projected Rental Receipts based on 80% increase in NASS Data Pg 24
Linear Right-of-Way Acres by State: Current and Final Rent (2007) • Rental Receipt Forecast • * 2009 Rental Rates Reduced by 25%. • ** Counties re-assigned to appropriate zones in 2011 based on 2007 • NASS Census Data (80% of average per acre land & building value. Pg 25
Rent Payment Periods(43 CFR 2806.24) • Annually • Individuals: when annual rent is greater than $100 • Non-Individuals: when annual is rent is greater than $500 per authorization. • Ten Year Intervals • Individuals: when annual rent equals $100 or less; • Non-Individuals: when annual rent equals $500 or less; • Term of Grant - upon request by any holder. • Perpetual Terms – one-time payments can not exceed 30 years except as provided by 43 CFR 2806.25 and 43 CFR 2806.26. Pg 17 Pg 27
Built-in Adjustment Features • Annually [43 CFR 2806.22(a)] - Adjust per acre rent based on change in ten year average in IPD-GDP index. • Five Years [43 CFR 2806.21]- Re-slot counties into appropriate rent zones based on 80% of new NASS Census Data. • Ten Years [43 CFR 2806.22(b)] - • Adjust, add, or delete rental zones to accommodate all county land values based on new NASS Census Data; • Re-calculate 10-year average of IPD-GDP; • Re-calculate new per acre rental values. Pg 28
Publication/Implementation • Prior to November 1, 2008: • Published final rule in Federal Register (73 FR 65040); • Issued news release; • Completed reprogramming of billing system; notified and trained billing system users (Oct. 20 – 24, 2008). • Briefed members of Western Utility Group on new rent schedule (Oct. 28, 2008). • Prior to January 1, 2009: • Issued 15,000 bills (due on January 1, 2009) to holders utilizing new per acre rent schedule. • On-going: • Respond to questions from right-of-way holders regarding new rental rates and billing periods. • Post 2007 NASS Census Data on BLM Web Site (3/1/09) • Notify Holders (by 6/1/09)