Download
1 / 34
340 likes | 467 Views
WASH NEEDS ASSESSMENT FOR Hajjah, Amran, Al Hudaydah and Raymah (28 DISTRICTS). Ahmed Alderwish PhD . London Uni. , Harvard Uni , Sana’a University. OBJECTIVE:

E N D
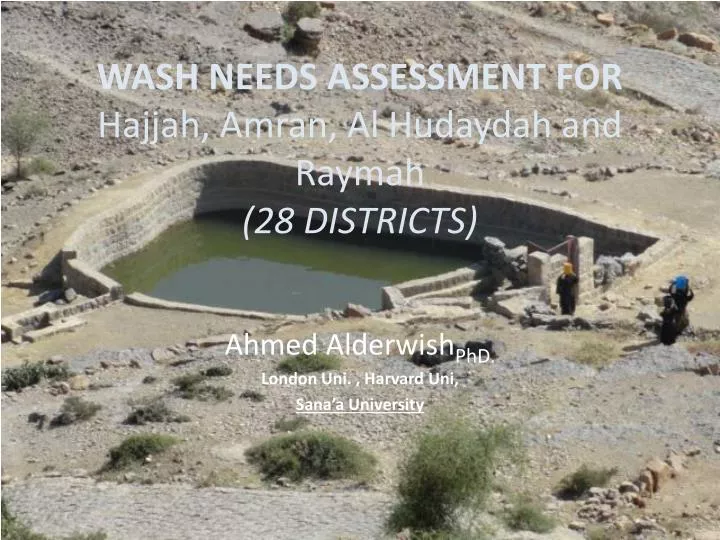
WASH NEEDS ASSESSMENT FOR Hajjah, Amran, Al Hudaydah and Raymah (28 DISTRICTS) Ahmed AlderwishPhD. London Uni. , Harvard Uni, Sana’a University
OBJECTIVE: The assignment assesses the situation of population in regard to WASH conditions, and addressing the needs of suffering population (estimated needs), mainly based on SPHERE/Local Standards with appropriate recommendations for actions.
METHODOLOGY • Interviews were conducted at village level, using rapid assessment (RA) technique with key informants and groups of villagers. Separate consultations with group of men and group of women were conducted in order to identify the location and type of facilities responding best to the needs of dignity and security of women and men. • Sampling process: • An inter-cluster priority rating developed by OCHA in consultation with the lifesaving sectors like WASH , Nutrition, Health and food were used to identify the targeted areas and population. These areas fall within 28 districts distributed in four governorates, namely: Al Hudaydah (66), Hajjah (72), Amran (30) and Raymah (30).
To conduct interviews at a village level, stratified one- stage cluster sample was designed for the selection of 198 villages. Each district considered to be a stratum. In addition, to related the survey to population, the number of villages per district was used as a basis to sample each district. • The sample of villages in each district was drawn using a probability proportional to size (PPS) sampling. This means that a denser households village gets a higher probability of being selected in the sample. Wear's a random systematic sampling was done after ordering sub-districts and villages by their codes to ensure sound representation of the district sample.
(ii) Data Collection • Undertaken uses a mix of quantitative and qualitative methods. • The data are captured in Excel/SPSS in order to generate various types of reports according to severity of need. • Assessment form composes: data sheets organized into sections, and summary conclusion sheet reflecting the joint findings of the assessment team. • The survey was undertaken over 5 days, between 3 and 8 Oct 2012.
(iii) Data analysis • The data collation and analysis tool used is automatically compile the collected data to produce a summary who- what- where- when report and an analysis of gaps (i.e. where there are high levels of need but no agency responding), in order to make critical programming and resource allocation decisions. • These also used to develop maps in order to be more effectively communicate response and specific gaps identified.
DESCRIPTION ANALYSIS OF THE SURVEY RESULTS A. Geography
B. Demography and Income • The rural population at the four governorates is 2.3 million (2012). • Total number of families reached were 38,150 with total population of 272,000 people. *(3950 are female headed families). • 94.9% of all families are below poverty line which equal 267.5 YR per person per day.
C. WASH borne diseases The total affected population by WASH borne diseases are 88,000 (32%) while death cases reached more than 2,000 people.
These figures indicate the need to secure safe water and proper sanitation facilities for residents, as those account for most of the deaths of children under five. They also cause great suffering in both adults and children through diseases associated with intestinal parasites.
D. WATER SITUATION • Water Sources • 81.1% of population is served by groundwater from various sources in forms of boreholes, dug wells and 19% are using surface water as a source. • The major reason for scarcity of drinking water sources are: • depletion of water sources and damage of existing water supply sources/networks; • Natural increase in population and displacement of people • Absence of water allocation and rights for communities • Contamination at water sources • Less coverage of GARWSP due financial constraints • Climate change
The point to ponder is that 46.5% of the whole districts' population are getting their drinking water from unimproved water supply sources. • Connected people have reported the limited benefit from the facility of piped water to their houses, therefore fetching of water is a common practice in these areas. Also in majority of these areas GARWSP is providing the services to the consumers but very less are operational, so people manage to operate by their own sources either surface or ground water.
28.3% of the total population are using less than 15 liter/day/person and those are requiring urgent intervention in their water supply provision. • 69.7% of the total population reported that their water supply is not sufficient for their households' needs.
75.7% of population reported that they failed to receive water as they need, mainly as their present source of water pertains the low yield, intermittent water points (wells and boreholes) in the project area. • 17.2% of population reported their water supply schemes/water points are not working, need repairs. • Presence of secondary sources for water supply at 65% of the sites confirm the inadequacy and unreliability of main water sources.
Keeping in view this situation recommendations are proposed for improvement of water supply system based on utilization of acceptable quantity and quality of water available in the surveyed districts. E.g. the existing sources are needed to be enhanced or new water sources are to be explored in the project area to fulfill the basic needs of the residents.
3. Water Quality • It is observed that 44% of responses reflected drinking water with bad taste, color and/or smell.
4. Water treatment • The analysis of the collected data is not very encouraging as over 70% of respondents did not know how to treat water prior to drinking and they do not practice any water treatment techniques. • The people who practiced some kind of treatment are only 25.8% of the population. Therefore there is a need of awareness to the community regarding water treatment methods at house hold levels and significance of using good quality water. Further, the treatment methods may be suggested after detailed quality tests of available water.
The important aspect to note is that there are such inhabitants, who have to travel for an hour (>60 minutes) and even more to fetch drinking water, and this percentage is the highest percentile of 43% (among time spent to fetch water). In addition, 20.4% of people spent more than an hour in queues for water at sources during collection. The recorded data reveals that the problem of fetching the water for the population needs urgent action as a large population of the project area has to fetch the water from a long distance travelling and long queues. The most affected by this activity are young children (girls) and women.
5. Water storage: 15,793 families <105 liter whereas 16,167 families> 105 liter .
Recent published study indicated that: contamination occurs due to the need for households to store water in the house instead of using tap water directly. This need arises from the shortage of supply, inadequate quantity supplied or expense. Although payment for consumption is generally good practice that would be expected to lead to high community participation in these schemes, proper tariffs based on affordability are essential.
E. SANITATION (EXCRETA DISPOSAL SYSTEM AVAILABLE) • People defecating in open areas, the most degrading consequence, is practiced by 16,670 families (121,590 people) and is the highest among all types. • It is interestingly to see that more rural Yemenis have access to mobile phone than toilets (just like African, Indian, etc.).
With these percentage (after 50 years since revolution) if extrapolate, these areas may arrive at the MDG target sometimes during the 22nd century. • STILL: The interventions should be focused on population, who do not have the latrine facility at all. Promising results have been achieved in an approach known as community-led total sanitation which promotes behavior change through peer group condemnation of open defecation as an anti-social habit (One world, 2012).
F. HYGIENE PROMOTION • Although for all families 28.6% haven’t got soap, it is very variable per sites. • 69.5% of families without sanitary goods for women, and therefore, action is needed to respond to the specific hygiene need of girls and women by the provision of female hygiene kits. • Hands are the main way in transmitting ‘parasitic’ diseases from one person to another. The collected data shows that 78.6% of families (213,600 people) are not washing their hands after defection.
The poor personnel hygiene of the rural population is direct results of the absence of promotion program on sanitation and hygiene. Consequently; urgent needs for promotion program on sanitation and hygiene to educate population on the cleanliness and encourage population to change to better hygiene practices.
G. SOLID WASTE, DRAINAGE AND VECTOR CONTROL • Only 13 sites (6.3%) with functioning garbage disposal facility or designated area of disposal. • Commonly, there are no drainage for rainwater in rural settlements in Yemen. In the project areas, 64 sites (32.3%) forms pools of stagnant water within the settlement area during rain seasons.
The situation regarding the measures for vector control are:
Detailed information is available in the DRAFT REPORT which will be circulated soon to you. Your feedback would be appreciated.