Download
1 / 5
50 likes | 163 Views
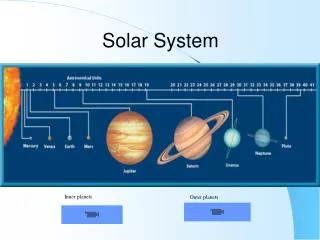
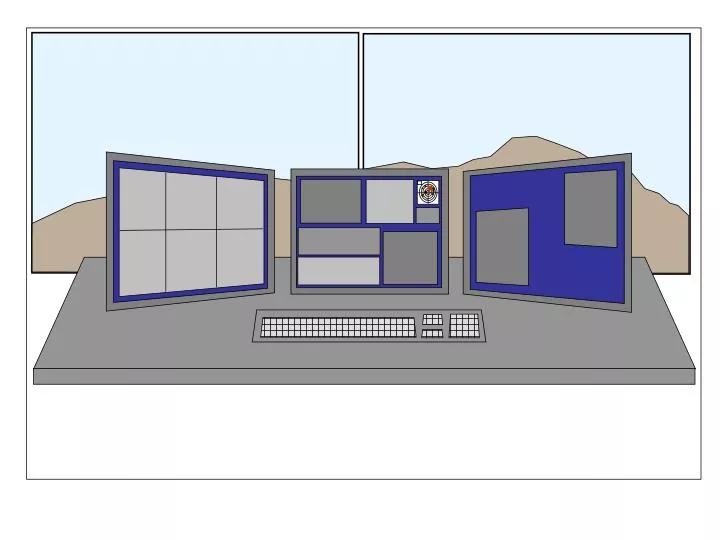
Solar System. Solar System. High Level Status and Command Screen – The Array Overview. 12m Array:. Mode = manual. Emergency buttons. System and Operations Status window: Information about what SBs are running: E.g., Subarray #, SB name, source, PI name

E N D
Solar System High Level Status and Command Screen – The Array Overview 12m Array: Mode = manual Emergency buttons • System and Operations Status window: • Information about what SBs are running: • E.g., Subarray #, SB name, source, PI name Software Status showing high-level status: • E.g., Exec, Control, 12m & ACA Correlator, Scheduler, Telcal, QuickLook, etc… Critical central electronics status: • E.g., Correlator, time reference, AOS-OSF link ACA: ALMA Overview Sub-arrays: 1 – 12m Array 2 – ACA 3 – Maintenance Antenna #s turn yellow/orange/red if problem exists Offline ants = blue All 1 2 3 4 Logger window showing things like: TAI 13:30:00 Archive query results: Optical point SBs TAI 13:35:01 Antenna 1 commanded to stow position TAI 13:30:15 Antenna 1 in Stow position, idle TAI 14:12:22 SB001 execution started PRIORITY 1 ALARMS: 1 Ant 01: 3mm receiver temp high 1 Ant 01: Power failure 1 Ant 37: Shutter not responding to command Click for sub-array pages Add scroll bars to some windows, as needed Click on red, orange, yellow, green tabs to see alarms associated with priorities 1,2,3,4 Click on ‘All’ to see all alarms. When all alarms visible, back light each one with the color associated with their priority. • Command interface to global array to run commands like: • Query Archive: list all available optical pointing SBs • Stow antenna 01 • Create Sub-array Name=Maintenance, Antennas=4,5 • Start optical pointing SB001 • Start SB list1 (list of SBs to run sequentially) • Ops log: Dark clouds rolling in Central control interface for Operator to command the system.
Sub-array Status, selection and Command Screen Click on SB in list, hit select to run Sub-array 1: 12m Array Solar System SB Scheduling: Select Scheduler Status: Running Highest ranked SBs for subarray 1: Phase & amp for each antenna now displayed • SB241: High-z galaxies • SB034: AB Aur debris disk • SB123: GRBs in local universe • SB042: Answer to everything • SB115: More outflow studies • SB189: RRLs in jets Only show ants for selected sub-array ALMA Overview Sub-arrays: 1 – 12m Array 2 – ACA 3 – Maintenance Observing: source name and type (changes with time). SB summary in some sort of table format. To include detailed information like: SB name, source name, receiver band, main spectral line ID, PI name, etc… All 1 2 3 4 Logger window showing things like: TAI 13:30:00 Archive query results: Optical point SBs TAI 13:35:01 Antenna 1 commanded to stow position TAI 13:30:15 Antenna 1 in Stow position, idle TAI 14:12:22 SB001 execution started PRIORITY 1 ALARMS: 1 Ant 01: 3mm receiver temp high 1 Ant 01: Power failure 1 Ant 37: Shutter not responding to command Click to get back to ALMA overview screen Keep the command, logger, and alarm panels the same – the Operator should be able to command and see system response while on this sub-array page. • Command interface to global array to run commands like: • Query Archive: list all available optical pointing SBs • Stow antenna 01 • Create Subarray Name=Maintenance, Antennas=4,5 • Start optical pointing SB001 • Start SB list1 (list of SBs to run sequentially) • Ops log: Dark clouds rolling in
time Side panel 1: Configurable Detailed Status GUIs Ant-Psn Rx Ant-Tk Cryo Wea SubA SBs Sftw WVRs LOs Ops Alarm Corr ACA Corr PRT Receivers Antenna Tracking Weather Wind speed Water column Give position and encoder status of selected antenna (perhaps ant 21 because it is in alarm state) 1mm Rms Phase Give detailed status of all receivers on selected antenna (perhaps ant 5 because a receiver appears to be out of limits) T(amb) = 10oC T(dew point) = 12oC Rel. Humidity = 5% Wind dir. = 200o Wind speed = 5 mph Solar flux = xxx Sched Blocks Alarms Cryogenics/Compressor • 12m Array SB: 101: • PI: Deb Shepherd • Prop. No. 321, Molecular Outflows • ACA SB 023: • PI: Tak Hayakawa • Prop. No. 543, Chemistry in Molecular Cores • Maintenance SB 001: • PI: Robert Laing • Optical Pointing 1 Ant 01: 3mm rx temp high 1 Ant 01: Power failure 1 Ant 37: Shutter not responding to command 2 Ant 3: Encoder position OOL 3 Ant 42: The answer to life, the universe & everything 4 Array: Wind speed greater than some threshold Give cryo/compressor status on selected antenna (ant 1 = default since none are selected – no problems here)
Xterm available to edit files, remote log in to other machines, query the archive for data, run the ALMA Observing Tool to create SBs, look at the QuickLook display, do offline data reduction, etc… Side Panel 2: Available for Operator to configure as needed Startup: • QuickLook Display • Archive Query Interface • ALMA Observing Tool • Offline Reduction Software • Problem Reporting Tool