Download
1 / 6
60 likes | 176 Views
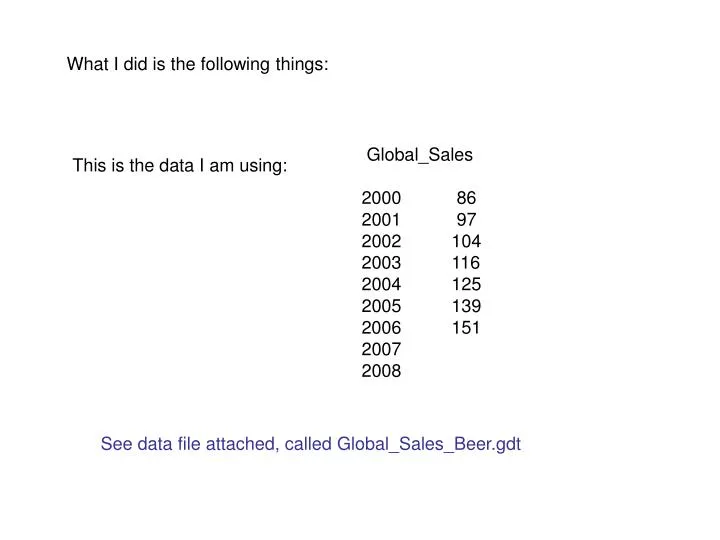
What I did is the following things:. Global_Sales 2000 86 2001 97 2002 104 2003 116 2004 125 2005 139 2006 151 2007 2008. This is the data I am using:. See data file attached, called Global_Sales_Beer.gdt.

E N D
What I did is the following things: Global_Sales 2000 86 2001 97 2002 104 2003 116 2004 125 2005 139 2006 151 2007 2008 This is the data I am using: See data file attached, called Global_Sales_Beer.gdt
Basically, what I did is this, I will try to put the commands as well. I selected Prais-winstens model Command: ar1 Global_Sales 0 Global_Sale_1 --pwe
These are the results: Performing iterative calculation of rho... ITER RHO ESS 1 -0.78655 3.28886 2 -0.88406 1.90769 3 -0.88300 1.92133 4 -0.88301 1.92133 Model 3: Prais-Winsten, using observations 2001-2006 (T = 6) Dependent variable: Global_Sales coefficient std. error t-ratio p-value --------------------------------------------------------------- const 0.0316658 1.22910 0.02576 0.9807 Global_Sale_1 1.09627 0.00581123 188.6 4.74e-09 *** Statistics based on the rho-differenced data: Mean dependent var 122.0000 S.D. dependent var 20.61068 Sum squared resid 1.921091 S.E. of regression 0.693017 R-squared 0.999308 Adjusted R-squared 0.999134 F(1, 4) 67981.14 P-value(F) 1.30e-09 rho 0.038633 Durbin's h 0.086394
Err1=0.693 Err2=0.709
Using the formula I saw in the script I have: err2 = sqrt((1 + rho^2) * SER^2) So, I have something like: err2 = sqrt((1 + (-0.88301)^2) * 0.693017^2) err2 = sqrt(1.779714 *0.480273) err2 =0.924526 0.92456 is different from 0.709, that is what I have in the other screen, Do you know why the numbers are different, Thanks
By the way, do you know how GRETL calculate the standard error for the next future periods, such as 3 or more years. Thank you very much for your time dedicated to my issue, I really appreciate it