Download
1 / 27
280 likes | 473 Views
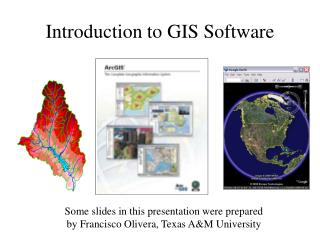
GIS Software Packages. Software for GIS: The Main Players. ESRI, Inc., Redlands, CA clear market leader with about a third of the market originated commercial GIS with their ArcInfo product in 1981 privately owned by Jack Dangermond , a legend in the field

E N D
Software for GIS: The Main Players ESRI, Inc., Redlands, CA clear market leader with about a third of the market originated commercial GIS with their ArcInfo product in 1981 privately owned by Jack Dangermond, a legend in the field Strong in gov., education, utilities and business logistics MapInfo, Troy N.Y. Aggressive newcomer in early 1990s, but now well-established. Strong presence in business, especially site selection & marketing, and telecom Intergraph (Huntsville, AL) origins in proprietary CAD hardware/software Older UNIX-based MGE (Modular GIS Environment) evolved from CAD Current GeoMedia was the first true MS Windows-based GIS strong in design, public works, and FM (facilities management), but weakening Bentley Systems (Exton, PA) MicroStationGeoGraphics, originally developed with Intergraph, is now their exclusive and main product.. Strong in engineering; advertises itself as “geoengineering” Autodesk (San Rafael, CA) Began as PC-based CAD, but now the dominant CAD supplier First GIS product AutoCAD Map introduced in 1996 Primarily small business/small city customer base The main two “pure GIS” companies.
Software for GIS: other players • Vector GIS • Smallworld Systems (Englewood, CO) • first to use OO (early ‘90s), but failed to compete as established vendors did same • Purchased by GE in 2000 • emphasis on FM & utilities • Manifold (CDA International Corp): • low cost, but low market share • Maptitude(Caliper Corp, Newton, MA): • another low cost one • Raster GIS • ERDAS/Imagine • long established leader • acquired by Leica Geosystems in 2001 • ER MAPPER • aggressive newcomer originating in Australia • Envi, • relative newcomer, radar specialization • acquired by Kodak in 2000 • PCI--Geomatica • long-term Canadian player • CARIS • newer Canadian entry • GRASS (Rutgers Univ.) • Classic old-timer originally developed by US Army Construction Engineering Research Lab(CERL) in Champaign, IL; • army ended dev. & support in 1996 but assumed by Baylor University. • IDRSI (Clark Univ) • pioneering, university-developed package
ESRI Product Line-up: ArcGISclient products (Fall 2007) • ArcReader(“adobe acrobat” for maps) & ArcExplorer(spatial data viewer) • Free viewers for geographic data. • ArcGIS 9.x Desktop: two primary modules (MS only) • ArcMap: for data display, map production, spatial analysis, data editing • ArcCatalog: for data management and preview • ArcToolbox, for specialized data conversions and analyses, available as a window in both • Available capabilities within these modules are “tiered” in three levels • ArcView: viewing, map production, spatial analysis, basic editing: • ArcEditor:ArcView, plus specialized editing: • ArcInfo:ArcView & ArcEditor plus special analyses and conversions: • Extensions: for special apps.: Spatial Analyst, 3D Analyst, Geostatistics, Business Analyst, etc. • ArcObjects: to build specialized capabilities within ArcMap or ArcCatalog using VB for Applications • ArcGIS Workstation (for UNIX and MS) • the old command line ArcInfo 7.1 • ArcGIS Engine (MS NT/2000/XP) • Set of embeddable GIS components (ArcObjects software objects) for use in building custom applications • Runs under Windows, Unix and Linux, with support for Java, C++, COM and .NET • Replaces MapObjects which were based upon a previous generation of GIS objects
ESRI Product Line-up: ArcGISserver products(Fall 2007) • ArcGIS Server:three tiers of capability • Data services: ArcSDE (Spatial Database Engine) • middleware to support spatial data storage in standard DBMS on server • Supports all major industry databases: • Oracle, SQL-Server, IBM DB2, Ingres • Map services: ArcIMS (Internet Map Server) • Provides maps and simple query to a user without a desktop GIS • Accessed via web interface • Analytic services: • Permits the creation of server-based specialized GIS applications • Provides full range of GIS capabilities to a user without a desktop GIS • Accessed via web interface • (prior to 9.2 these were sold as three separate products) • ArcGIS On-line Services • On-line services made available on the Internet with a subscription • Normally charged on a “per transaction” basis, but can be flat fee • built and operated by ESRI (or other others), usually based on ArcGIS Server
ArcInfo ArcEditor ArcView ArcExplorer Browser Internet ArcIMS Services Map display & query ESRI ArcGIS System Consistent interface Increasing capability Clients c:\ ArcGIS Workstation $ ArcMap ArcCatalog ArcToolbox ArcMap ArcCatalog ArcToolbox ArcMap ArcCatalog ArcToolbox ArcServer Services Full GIS analysis ArcEngine/ ArcObjects Application Development & Customization ArcSDE Services Database storage/access Source: ESRI with mods.
What is ArcGIS Desktop? ArcGIS Desktop is a GIS product created by ESRI (Environmental System Research Institute) that allows you to analyze your data and author geographic knowledge to examine relationship, test predictions, and ultimately make better decisions. • It is family of three products • ArcInfo • Arc Editor • ArcView • That shares the same core applications, user interface, and development environment All three software products look and work the same—they differ only in how much they can do. ArcEditor does more than ArcView, and ArcInfo does more than ArcEditor Each ArcGIS Desktop product includes two applications: ArcMap and ArcCatalog™. ArcMap is the application you work with to explore and analyze data and make maps. ArcCatalog is the application you work with to manage data. Additionally, ArcToolbox™ is an integrated application that contains many tools for GIS tasks. You can access ArcToolbox from both ArcMap and ArcCatalog
ArcView Key Features of ArcView: - ArcView allows performing basic visualization (map authoring), spatial query, editing and data integration, and basic modeling and analysis of your data. Visualization: o Map authoring: e.g. predefined map templates to save time, easy to create a consistent style maps, etc. Spatial query: o e.g. measure distances and areas, find features in the map, select data by location or attribute, switch the selection, access layer properties, etc. e.g. Proximity analysis ‐ to find out which closest services.
Simple feature editing and data integration: o e.g. create/edit point, line, and polygon features and attributes, integrate variety of data types including demographics, facilities, CAD drawings, imagery, web services, and multimedia. e.g. quickly make changes to several features (records) at once. Basic modeling and analysis: o e.g. model spatial relationships, generate charts/reports from findings, etc. Ready‐to‐Use Datasets: o e.g. ESRI Data & Maps Media Kit, which is updated annually and preconfigured to work specifically with ESRI software. Enabled for extensions: o e.g. add even more capabilities ‐ Analysis, Productivity, and Solution‐based extensions perform extended tasks such as raster geoprocessing and three‐dimensional analysis.
ArcView Components: ArcMap, ArcCatalog and ArcToolbox ArcMap: Integrated map display, editing, and production environment. ArcMap is used to display, query, edit, create, and analyze your geographically referenced data. Example: . ArcMap compositions including charts and reports effectively communicate your message. Various styles for legends, scale bars, north arrows, and other map design tools are readily available in the ArcMap environment
ArcCatalog: data management application ArcCatalog helps users to browse, search, explore, view, and manage data (with metadata creation and editing capabilities) and maps. It also helps GIS database administrators maintain spatial and tabular GIS data for use by others in their organization. ArcCatalog interface: File/data types:
ArcToolbox: geoprocessing tool. ArcToolbox helps users to perform geoprocessing operations such as data conversion, overlay processing, buffering, proximity analysis and map transformation. Each tool has a menu‐driven interface with wizards or dialogs.
ArcMap ArcMap can be launched by clicking on the icon on the Standard tool bar in ArcCatalog or launched from the Start menu Check off “ A new empty map” and click OK to add new map
Title bar and toolbars: Title bar: displays the name of the ArcMap document. Toolbars: contains many toolbars viz. Main Menu: default tool bar with pull‐down menu that contains: File, Edit, View, Insert, Selection, Tools, Windows and Help. Click on these menus to select various options within each menu. Draw: allows drawing and editing graphics/text on the map and layout. Layout: allows display, zoom and scale layouts. Standard: allows creating a new document, opening an existing document, saving and printing a document, editing functions, adding/editing map and data, opening ArcCatalog and ArcToolbox, opening Model Builder, and activating help. Tools: allows working with data view frame or work space viz. displaying, zooming, selecting, identifying, finding and measuring features and elements. Several other toolbars can be made active by right‐clicking on the Main Menu toolbar or by clicking on the pull down Main Menu/View/Toolbars…
Table of Contents: displays and manages (group, ungroup, activate, access layer properties, etc.) all the layers (and its source) and symbology of the layers. Data Frame: work space that allows displaying and working with map/s. Data Frame displays maps as layers that are checked in the Table of Contents. Each displayed layer does not store the actual geographic data but it references data stored in shapefiles, geodatabases, etc. Status Bar: displays coordinates/units of the cursor in the Data View or Layout View. Layers: A layer contains information about how to display the dataset, but not the dataset itself. Each data frame contains one or more layers. Any datasets you add to the map are represented as layers in the Table of Contents. Checking the box next to each layer will display the map elements. The order of the layers will display map elements in that order. Table of Content
Add and remove layers To add layers for display click on Add Data icon located on the Standard Toolbar. Navigate to the shapefile that you would like to connect to. For instance: Select “few Shp files from the location” Multiple select by pressing ‘control’ key while selecting files). Highlight the file and click on Add button. Notice that all the layers are added to the Table of Contents as well as displayed (if checked) in the Data View or Layout View (whichever is active). Every time you bring in any layer, it will be displayed with random colors and can always be changed. To remove the data, select the layer then right click on the layer and click on remove.
View the data – examining the Attribute Table of the layer Select the layer and right click on the layer and then select open Attribute Table. Examine the table – rows corresponding columns.
Examine Layer Properties • Right click on a layer and click on the Properties. This will display Layer Properties window. You can view, edit and change various properties of the layer. • General tab allows changing the name of the layer, adding description and credits, and make the layer invisible at a certain scale. • Source tab allows viewing the metadata and editing the data source of the layer. Selection tab allows customizing selection symbology. • Display tab allows changing transparency of the layer. • - Symbology tab allows customizing and importing symbology of the layer via Features, • Categories, Quantities, Charts and Multiple Attributes. Fields tab allows displaying fields. • Definition Query tab allows to write scripts to query the data via Query Builder. • Labels tab allows displaying, changing symbology, and defining placement, scale and style of the labels. • Join & Relates tab allows joining and relating various datasets. • - HTML Popup tab allows showing the content of the layer using HTML Popup tool.
Understand Data View (workspace) and Layout view • Data View allows displaying, editing, analyzing and working geographic data. • Layout View allows preparing finished maps for printing and publishing. • Three ways to switch between Data View and Layout View: • Click on the View tab of Main Menu toolbar and then click on Data View or Layout View. • 2. Click on for Data View, and click on for Layout View. • 3. Click on the icons on the Layout toolbar for Data View, Layout View • and to switch between the two. Finalize and save the map On the Layout View, you can insert toolbar title, legend, scale and north arrow, via Insert tab on Main Menu, to finalize the map. Save the map by clicking on the File tab on the Main Menu toolbar. The Save dialogue box will pop up. Name the document, navigate to the location and click Save. The map will be saved as ArcMap Document (.mxd), which will contain all the working layers and referenced data. To save the map as PDF or JPG, click on File tab on the Main Menu toolbar and click on Export Map. Navigate to the location, select the type as PDF or JPG from pull down menu, and click Save.
ArcCatalog Launch Application: ArcCatalog can be launched by clicking Start>Programs>ArcGIS>ArcCatalog ArcCatalog can also be launched by clicking on the icon on the Standard tool bar in ArcMap. Understanding the interface and its main features - Toolbars - Catalog Tree and Contents/Preview/Metadata window
Toolbars: contains many toolbars viz. Main Menu: default tool bar with pull‐down menu that contains: File, Edit, View, Go, Tools, Windows and Help. Click on these menus to select various options within each menu. Standard: allows connecting to any folders on hard drive as well as folders on the network drives, disconnecting from folder, copying, pasting, deleting, viewing and searching files and folders. It also allows launching of ArcMap, Arc Toolbox, Command Line Window, Model Builder and Help. Catalog Tree: displays all connected files and folders, and their directory tree. C/P/M Window: allows examining name and type of the file, previewing content (geography and tabular data) and viewing metadata of the file. Connect to Folder Click on the File tab on the Main Menu toolbar and select Connect to Folder or Click on the icon Navigate to the desired folder in the Connect to Folder dialog box and click OK.
Preview spatial data and metadata Select the shape file in the Catalog Tree to preview its spatial data and meta data. For instance, select one of .shp file (layer) in the Catalog Tree. Click on the Content tab in the C/P/M Window to view the name of the file and the type of the file.
Click on the Preview tab in the C/P/M Window. Click on Geography tab from the pull down menu at the bottom of the C/P/M Window to view the physical shape of the file. Click on the Table tab from the pull down menu at the bottom of the C/P/M Window to view the tabular data associated with that geography/shape.
Click on the Metadata tab in the C/P/M Window to view the metadata of the file. Description tab displays brief description (Abstract, Purpose, Supplemental Information, Place, Status of the Data, Time Period, etc.) about the shape file. Spatial tab displays information about various coordinate systems used to create the shape file, coordinates, and sources of the file. Attributes tab displays features and attributes of the data associated with the shape file
Bring the data into ArcMap Launch ArcMap and display the window to full extent. Make the ArcCatalog window smaller than ArcMap such that ArcCatalog window floats on the ArcMap window. Select one layer or multiple layers by use of Shift and Control keys from the C/P/M Window. Once the layers are selected, drag and drop them in the Table of Contents window of the ArcMap. Alternatively, you can add data from ArcMap by clicking on the icon located on the Standard Toolbar. Source: ESRI.com