Download
1 / 29
290 likes | 502 Views
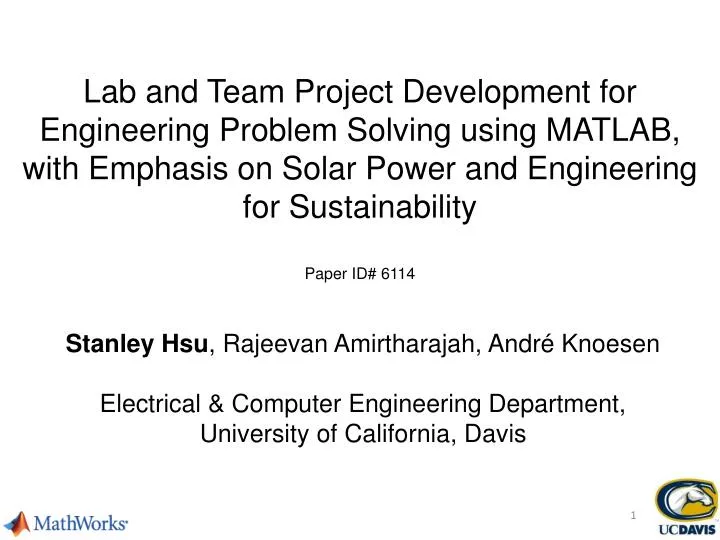
Lab and Team Project Development for Engineering Problem Solving using MATLAB, with Emphasis on Solar Power and Engineering for Sustainability Paper ID# 6114. Stanley Hsu , Rajeevan Amirtharajah, André Knoesen Electrical & Computer Engineering Department, University of California, Davis.

E N D
Lab and Team Project Development for Engineering Problem Solving using MATLAB, with Emphasis on Solar Power and Engineering for Sustainability Paper ID# 6114 Stanley Hsu, Rajeevan Amirtharajah, André Knoesen Electrical & Computer Engineering Department, University of California, Davis
Outline Introduction Course Flow and Lab Topics Arduino Solar Module Individual and Team Project Assessment Results Summary
Introduction • Goal: Update Existing Curriculum • Sustainability focused • Hands-on experience • Project-based learning • Course Structure • Size: Fall, 175+; Winter, 250+; Spring, 150+ • Demographics: multiple engineering disciplines, mostly freshmen and sophomores but all classes represented • Objective: engineering problem solving using programming • Course Components • Lecture: twice a week, 90 minutes each • Lab: weekly timed programming exercises, 50 minutes • Projects: one individual and one team • Homework: weekly UC Davis Robert Mondavi Institute Teaching Winery
Outline Introduction Course Flow and Lab Topics Arduino Solar Module Individual and Team Project Assessment Results Summary
Course Flow and Lab Topics Quarter Starts Quarter Ends www.ece.ucdavis.edu/sustainableENG6 Fundamentals • 1D and 2D Array • Flow Control • Looping Constructs • 2D and 3D Plotting • Text and File I/O • Interpolation and Numerical Integration Advanced • Monte Carlo Technique • String Manipulation • Graphical User Interface • Object-Oriented Programming • Regular Expressions
Weekly Lab Exercises www.ece.ucdavis.edu/sustainableENG6 • Problem 0: Challenge Problem • Single part problem based on previous homework and lab • Minimal instruction given • Expected completion time: 10-20 minutes • Problem 1: Skill Building Problem • Multi-part problem based on newly introduced concept • Step by step instructions given • Expected completion time: 30-40 minutes
Outline Introduction Course Flow and Lab Topics Arduino Solar Module Individual and Team Project Assessment Results Summary
Arduino Solar Module www.ece.ucdavis.edu/sustainableENG6 • Hands-on Experience • Improve student engagement in engineering • Increase student interest in electronics • Hardware Module • Based on Arduino UNO • Solar cell to measure light • Programmable via MATLAB
Arduino Solar Module BOM Bill of Materials www.ece.ucdavis.edu/sustainableENG6
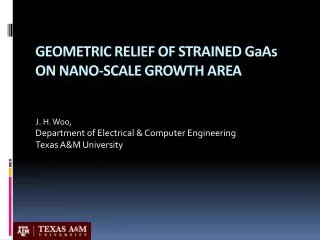
Arduino Solar Module Schematic Solar Cell Receptacle Open Circuit (OC) Header + - + - USB OPEN DS1803 ARDUINO UNO H0 (14) W0 (12) VCC VCC (16) GND (8) SDA SDA (10) VCC 5V SCL SCL (9) GND L0 (13) A0,A1,A2 (7,6,5) Atmega MCU A0 H1 (1) W1 (4) OPEN SDA A4 SCL A5 I2C Interface L1 (3) www.ece.ucdavis.edu/sustainableENG6
Arduino Solar Module Software www.ece.ucdavis.edu/sustainableENG6
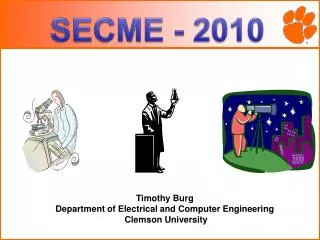
Arduino Solar Module Output • Flashing Lights • Lab given after fundamental topics IV Curve
Outline Introduction Course Flow and Lab Topics Arduino Solar Module Individual and Team Project Course Assessment Summary
Individual Term Project • Time: 2 weeks • Topic: Analysis of weather data of 53 cities across 12 months • Data given • Precipitation • Solar radiation • Wind speed • Land area • Population • Compute solar and wind power available • Estimate available rainwater for collection • Comparison between types of renewable energy
Final Team Project • Time: 4 weeks • Team of 3 students • Lecture on design cycle, project planning, team organization • Teams choose from multiple project options • Design project • GUI flow and design • Data organization and structure • Submit: • Preliminary report, final report, code, video presentation
Outline Introduction Course Flow and Lab Topics Arduino Solar Module Individual and Team Project Assessment Results Summary
Assessment Results Questionnaire implemented using Google Form 403 students from four quarters 105 responses were received
Outline Introduction Course Flow and Lab Topics Arduino Solar Module Individual and Team Project Assessment Results Summary
Summary • Revised curriculum for problem solving class using programming • Sustainability theme incorporated in labs and projects • Hands-on experience enabled by low-cost custom Arduino Solar Module • Project-based learning through individual and team projects
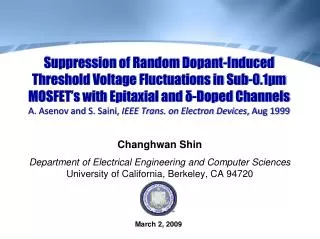
Future Work Solar Cell Wireless Module TI MSP430 Launchpad TI MSP430 Launch-pad eZ430-RF2500 Wireless Dev. Kit • Lower cost and increase functionality • MSP430 microcontroller and wireless module
Future Work Arduino or MSP430 Programmable Gain Analog Front-End Sensors MATLAB Increase MATLAB programmability and functionality of module Increase hands-on lab exercises Multi-sensor interface:
Acknowledgements • Mathworks for funding and guidance. • Dr. GiampieroCampa • University of California, Davis for implementation and development. • MikaelaHuntzinger and Karen Dunn-Haley (assessment) • Lance Halsted (Arduino development) • Shane Austin (course work and Arduino dev.) • Ryan Wilkerson and Alex Chan-Kai (TI wireless module) • Alexander McCourt and other ENG6 Teaching Assistants (implementation) • ChikBrenneman (RMI teaching winery tour) • Prof. Roger Boulton • Texas Instruments (MSP430 dev. kit donation)
Course Flow and Lab Topics The average cost of solar energy technology steadily decreases at a rate of 6% every 18 months, and the average cost of coal-based electricity steadily increases at a rate of 3% every 18 months. How long (in months) until the average cost of the two technologies becomes equal? The current average cost of solar energy to be $156.9 per MWh, and the average cost of coal-based electricity to be $99.6 per MWh. solar = 156.9; coal = 99.6; while solar > coal solar = solar - solar*0.06; coal = coal + coal*0.03; i = i+1; end fprintf(‘In %d months, solar energy becomes cheaper than coal-based electricity.\n', i*18) fprintf('Solar cost: $%5.2f; Coal-based cost: $%5.2f;\n\n', solar, coal); www.ece.ucdavis.edu/sustainableENG6 Challenge Problem Solution
Course Flow and Lab Topics Task 1: Write a (stand-alone, not anonymous) function that return the output voltage and current of a solar panel given the number of rows and columns of photodiodes in the solar panel. The equation that gives the output voltage and current of a solar panel is below. The function header: [VoutIout] = solar pane(Nrow, Ncol) Output Voltage (Volts), Vout=Number of rows*0.6 Vols Output Current (mA), Iout=Number of columns*50 mA (mA = milli-Amperes = 10^-3 Amperes) Task 2: (Complete this task in the same script for Problem 1) The maximum output power of the solar panel is 90% of the product of the output voltage and output current. Using the function you wrote in Task 1, write a script that calls this function to calculate the maximum output power for square solar panels with sides ranging from 10 photodiodes to 100 photodiodes. In a square solar panel, the number of rows is equal to the number of columns. Task 3: Write code (in the same script as Task 2) to plot the maximum output power for square solar panels versus the total number of photodiodes (for Nrow = Ncol = 10 to 100) in the solar panel. (x-axis is the number of photodiodes and y-axis is the maximum output power) Do not modify the function 'solar panel()'. www.ece.ucdavis.edu/sustainableENG6 Skill Building Problem