Download
1 / 46
470 likes | 647 Views
MARKETING RESEARCH AND MARKETING INFORMATION SYSTEMS. Marketing Information Systems (MkIS) Primary vs. secondary data Advantages and disadvantages of each Marketing research tools. Learning Objectives. Appreciate the costs and benefits of research

E N D
MARKETING RESEARCH AND MARKETING INFORMATION SYSTEMS • Marketing Information Systems (MkIS) • Primary vs. secondary data • Advantages and disadvantages of each • Marketing research tools
Learning Objectives • Appreciate the costs and benefits of research • Appreciate the uses of both primary and secondary market research • Appreciate the respective advantages and disadvantages of different primary research methods • Develop an understanding of research method problems that can lead to misleading or incorrect conclusions. • Understand the proper sequence of research activities.
Marketing Research • An “investment” to reduce uncertainty • Can help guide decisions on • Whether to enter • Product characteristics • Promotional strategy • Positioning • Must weigh costs and benefits of research • Money • Time spent • No perfect method—tradeoffs between methods
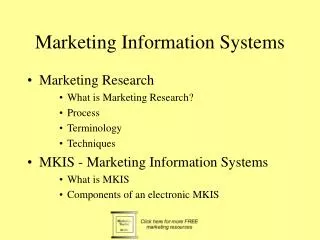
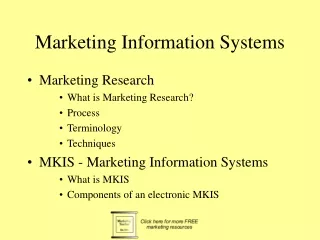
Marketing Information Systems (MkIS) • Set of procedures and methods for regular collection and analysis of information for marketing decisions • Databases (internal information—e.g., sales volumes) • Market research • Primary • Secondary
Data Mining • Processing of vast amounts of data to find relationships between variables—e.g., • Items frequently purchased together “strategic adjacencies” (items placed together in retail setting) • Seasonal patterns in sales • Customer segments
Primary Research Methods • Surveys • Experimentation • Observation • Focus groups • In-depth interviews • Projective techniques • Physiological Measures • Online research • Scanner data • Conjoint Analysis • Hybrid Methods
Primary Research Methods • Exploratory Methods • Observation (can be more definitive with larger sample sizes and focus on specific behavior) • In-depth interviews • Focus groups • Projective techniques • Precision Methods • Experiments • Surveys • Panel • Scanner data
Choosing a Primary Research Method Can the respondent answer accurately? (What someone consciously believes may differ from “deeper” opinions; beliefs about hypothetical products may not be well developed.) Does the question involve OPINIONS or BEHAVIOR? OPINIONS BEHAVIOR NO Can the relevant behavior be observed in the customer’s natural environment? PROJECTIVE METHODS YES EXPLORATORY or PRECISION research? YES NO SCANNER DATA (e.g., brand choice, impact of advertising, previous purchases, competing brands, demographics) EXPERIMENTATION (determine causality—e.g., impact of product design, advertising message) EXPLORATORY PRECISION OBSERVATION (e.g., how long does the shopper spend? What does he or she look at? Is anyone else involved?) PHYSIOLOGICAL (e.g., determine reactions, attention, arousal) INDIVIDUAL INTERVIEWS SURVEYS FOCUS GROUPS
Surveys • Forms • Mail (self-administered, single time) • Mail panel (self-administered, multiple surveys administered over time) • Telephone (from central location) • Mall Intercept • Computer/Internet • Planned questions • Open-ended • Closed-ended • Need large sample sizes for precise conclusions • Small samples will have very large standard errors and thus large margins of error • E.g., Presidential polls (with only two choices) require a little more than n=1000 to get results accurate to +/- 3%. SURVEY COSTS: USUALLY LOW
Characteristics of Some Problematic Questions • Difficult to answer—respondent may not have knowledge needed • Amounts spent annually on specific product categories may not be known • Sensitive (embarrassing) • Two in one—e.g., “On a scale from 1 to 10, how fast and reliable are Microsoft programs?” • Leading questions—giving the feeling of the “desired” response • “Do you agree that soft drinks with sugar are bad for you?” • Non-exhaustive question • Non-mutually exclusive answers
Continuum Questions • Questions rating the degree of a characteristic (e.g., agreement or product usage) tend to be more effective than binary “Yes/No” questions • E.g., 5 4 3 2 1 Strongly Neither Strongly Agree Agree Agree Nor Disagree Disagree Disagree
Continuum Scales • Rather than asking binary (e.g., “Yes” vs. “No”) questions, it is usually better to ask about a matter of degree or extent • E.g., “On a scale from 1-10, with 1 being ‘Not all interested’ and 10 being ‘Extremely Interested,’ how interested are you in fashion? • Asking simply “Yes” or “No” on “Are you interested in fashion?” would result in people with very little actual interest potentially answering affirmatively
Some Areas Suited for Continuum Ratings • Interest • Purchase likelihood • Satisfaction/ Dissatisfaction • Brand loyalty • Price sensitivity • Knowledge • Experience • Involvement • Decision control • Frequency or level of use • Awareness • Information search • Personality traits • Variety seeking
Experimentation • Subjects in different groups treated differently • E.g., for some, “target” product is given better shelf space • E.g., some get coupon • Can help isolate causes • Subject is not biased by questions—does not know how others are treated EXPERIMENT COSTS: HIGH
My Simulated Store… A shopper in the everyday low price condition…
Ash’s Instant Coffee Study GROCERY SHOPPING LIST Ground beef Potatoes Apples Flour Sugar Laundry detergent Instant coffee 6 cups of yogurt Paper towels Bananas GROCERY SHOPPING LIST Ground beef Potatoes Apples Flour Sugar Laundry detergent Ground coffee 6 cups of yogurt Paper towels Bananas Respondents were asked to describe their impressions of a housewife based only on her shopping list. These shopping lists differ only on one item.
Definition • Confound: An illusion of one variable causing another because of correlation between two variables • E.g., does having more toys cause children to be more intelligent?
Some types of confounds Actual cause Illusory cause • A appears to cause B but it is actually B that causes A • Examples: • Diversification and profitability. Diversified firms tend to have higher profit levels. This may be because more profitable firms need to find ways to re-invest profits rather than because diversification causes profitability • Sales of a brand of soda are higher during weeks of heavy advertising. However, advertising is allocated when the stakes are greatest (e.g., during holidays and summer months). Thus, anticipated sales actually cause advertising. B A
Some types of confounds Actual cause Illusory cause • A appears to cause B but both A and B are actually caused by C • Examples: • On the average, the more toys a child has, the higher his or her IQ. Both the number of toys and IQ may be caused by family resources such as income (providing for better nutrition and better education) • Individuals taking anti-depressive medication have higher rates of suicide than the general population. This is because those who take anti-depressive medication are more likely to be depressed. In fact, individuals suffering from depression are less likely to commit suicide than those with depression who do not take medication. • On the average, students who sit in the front of the class end up with higher grades. However, students choose where they sit. B C A
Some types of confounds Actual cause Illusory cause Correlation • A appears to cause B but both A is correlated with C, with C ultimately causing B • Examples: • Sales of laundry detergent are higher during weeks when the brand is advertised. However, when the brand is advertised, there is always a price promotion (temporary price reduction). Most of the sales increase results from the price discount with a much smaller portion coming from advertising. The deeper the discount, the greater the sales. • Members of fraternities and sororities on the average have higher GPAs than people not in the Greek system. There may be some benefits to Greek membership causing higher grades, but members of the Greek system also tend to come from more privileged backgrounds. B C A
Confounds • What is cause, what is effect, and what is coincidence? • Correlation is not necessarily cause • “Lurking” factors may be real cause • Does sitting in front of the room cause higher grades? • Does Prozac cause suicide? • Do fish-heavy diets cause stomach cancer? • Does fraternity/sorority membership cause higher grades?
Some other influences on the relationship between variables • Restricted range: One population includes only a portion of another or the sample includes only a small portion of the population range—e.g., • High school GPA school is a limited predictor of college GPA since students with higher high school GPAs tend to get into more competitive colleges • Among residents of Rancho Palos Verdes, household income does not predict dental health. In society as a whole, many people have difficulty paying for quality dental care, but most residents of Rancho Palos Verdes are relatively affluent • “Diluting” variables: Variables not considered “drown out” much of the effect of the variable of interest—e.g., • Income is a limited predictor of spending. Although a certain level of income (or wealth) is needed to buy certain things (necessary condition), income is not a sufficient condition. Many high income individuals are rather stingy and many lower income individuals live above their means. • Ethnicity is a limited predictor of food preferences. Many Caucasians, African-Americans, Latinos, and Native Americans like raw fish.
Observation • Looking at consumes in the field—e.g., • Searching for product category area • Number of products inspected and time spent on each • Apparent scrutiny of labels or other information • Involvement of others • Behavior under limiting circumstances (e.g., time constraints) OBSERVATION COSTS: LOW TO HIGH (DEPENDING ON CODING AND ANALYSIS NEEDED)
Taste Tests • Not experiments unless • Two or more groups of people are treated differently (e.g., get different food version) or • The same person is being treated differently at separate times (e.g., half the participants receive new formulation, then current; half the participants receive in the opposite order) • “Triangle” Measure • Each respondent is given three items: One current, one new, and one duplicate of either old or new • Asked to identify the one that is different and explain why
Focus Groups • Groups of 8-12 consumers assembled • Start out talking generally about context of product • Gradually “focus” in on actual product Usually NOT the best approach. Should NOT be chosen as default research method! MOST APPROPRIATE AS EARLY STAGE METHOD FOCUS GROUP COSTS: HIGH (ESPECIALLY FOR THE AMOUNT OF INFORMATION COLLECTED)
REMINDER • Focus groups are most useful for identifying issues that should be studied in more detail with more precise methods • Due to the small sample size and social influence on individual responses, it is difficult to generalize much from focus groups
In-depth interviews • Structured vs. unstructured interviews • Generalizing to other consumers • Biases • Subtle, inadvertent feedback IN-DEPTH INTERVIEW COSTS: HIGH
Projective Techniques • Getting at motivations that may not be consciously known— “Tell a story about this picture.” • Measurement of attitudes consumers are unwilling to express • It is easier to admit something embarrassing about someone else • Consumer discusses what other consumer might think, feel, or do PROJECTIVE METHODS COSTS: USUALLY HIGH IF PERSONAL INTERVIEWS OR EXTENSIVEINTERPRETATION IS NEEDED
Projective Examples “Please tell me a story of what is going on in this picture.”
Physiological Measures • Consumer bodily responses are watched at various phases of advertisement or other marketing exposure • Tracking of • Eye movements • For areas of focus • For attention, involvement • Heart rate • Skin conductivity • Brain waves • State of mind • Attention PHYSIOLOGICAL METHODS COSTS: HIGH
Online Research—Analysis of Customer Search Queries • Unmet demand—search for product not found on site • Message comprehension—comparison of search terms to media message • Consumer vocabulary • Feedback analysis ONLINE SURVEY COSTS: USUALLY LOW
Online Surveys • Conditional branching—direct skip to relevant question • Quality of response • Time pressures • Willingness to write out answers or respond to multiple closed-ended questions • Willingness to read and follow instructions is limited • Reliability and browser compatibility issues
Conditional Branching • Traditional surveys: Have you bought a new car during the last six months? If not, please skip to Question 11. • Conditional branching: Respondent will be taken to the appropriate question according to answer • Customization of questions • E.g., consumer lists three brands subsequent questions ask about these specific brands by name
Other Online Tools • “Click Stream Analysis:” Analysis of “clicking” path—how does the consumer get to a desired page or product? • Shopping cart analysis COSTS: HIGH START-UP COSTS; LOW VARIABLE COSTS POSSIBLE WITH DEVELOPED ALGORITHMS USUALLY LOW COSTS: HIGH START-UP COSTS; LOW VARIABLE COSTS POSSIBLE WITH DEVELOPED ALGORITHMS USUALLY LOW
Searching for Reports of Personal Experience • Sources • Blogs (blogsearch.google.com) • Photos (e.g., Flickr, Webshots, Picasaweb, Google image search) • Video (e.g., Youtube) • Cautions • May be “staged” or sensationalized • May represent what the writer or photographer wants to show • May be limited entries on certain “mundane” tasks such as dishwashing • Some issues • Joy, enjoyment • Decisions • Anxiety • Social setting and influence
Conjoint Analysis: Determining the Relative Importance of Product Attributes • Consumers rate several “profiles” (combinations of features) • Statistical analysis is used to “decompose” ratings into preferences
Example Car #2 Gas mileage: 20 mpg Price: $15,200 Safety record: Excellent Performance Poor Reliability Excellent How would you rate car #2 overall on a scale from 1 (Very poor) to 7 (Excellent?) 1 2 3 4 5 6 7 Car #1 Gas mileage: 30 mpg Price: $18,200 Safety record: Average Performance High Reliability Poor How would you rate car #1 overall on a scale from 1 (Very poor) to 7 (Excellent?) 1 2 3 4 5 6 7 Each subject will evaluate several (usually 16+) combinations. A statistical technique determines the importance of each feature.
Conjoint Analysis: Advantages • Reveals ultimate preferences of consumers when competing influences exist • Able to predict desirability of combinations not actually explored • Can estimate contribution of each factor and assess its cost effectiveness • Will consumers pay $500.00 to reduce the weight of a laptop computer by 2 lbs?
Conjoint Analysis: Disadvantages • May be difficult for subjects to rate many combinations • May need a large number of subjects for accurate measurement/sufficient precision • Must identify relevant attributes and levels in advance • Subject must know about product category (attributes must be meaningful)
Types of scanner data • Supermarket club. This includes purchases by the specific customer when shopping at the respective chain (assuming that the customer presents his or her card). Purchases at other locations are not counted. Demographic information may be of limited accuracy. Shoppers are often motivated to join by large discounts (often 20-30%). This is also a method of price discrimination. Members may be given individualized coupons for possible products of interest. Only available for grocery products. • Scanner data panels. In some communities, people can sign up to be part of a “panel.” Purchases at all local retailers are included (e.g. supermarkets, gas stations, drug stores, convenience stores). For a given customer, the database also includes TV viewing and demographics. Only available for grocery products. • Aggregated retail sales records. Records of sales volumes of products by UPC may be available from an assortment of retailers. This information is NOT tied to individual customer data and purchase history. This is available for more types of products.
Scanner Panel Data • Panel members in test communities agree to • Swipe a card prior to each purchase • Have purchases matched to • Demographic profiles • Media/coupon exposure • Promotional status of competing brands • Past purchases • Problems: • Aggregation over household • Aggregation bias--averages of disparate segments obscure! • Only available for grocery and some drugstore products COSTS: HIGH START-UP COSTS; LOW VARIABLE COSTS POSSIBLE WITH DEVELOPED ALGORITHMS USUALLY LOW
Scanner Data Panel Research(Some of these variables are available for supermarket club data) Purchase on occasion: Yes, no Time since previous purchase Previous purchases Current price Previous price Current promotional status Previous promotional status Current display status Previous display status Display status of competing brands Promotional status of competing brands Coupon used: Yes, no Coupon available: Yes, no Coupon available for other brands? Yes, no Amount of coupon No. of ads seen by shopper Ads seen for competing brands “Split cable” RECORDED PURCHASES TELEVISION EXPOSURE HOUSEHOLD FILE DEMOGRAPHIC INFORMATION ANALYSIS Family size Occupation Family size Income Home ownership
SCANNER DATA BASED METHODS OF SEGMENTATION • Price responsiveness • Price sensitivity (impact of current price on the likelihood of purchase and/or quantity purchased). The brand elasticity is greater than the product category elasticity. • Deal proneness (propensity to switch to a non-preferred brand when such a competing brand price promotes through sales, coupons, or other form of discount). [This is one form of limited brand loyalty] • Purchase acceleration (“stocking up” when an item is on deal—sale and/or coupon) • Non-price based brand switching • Variety seeking [Another form of limited brand loyalty] • Accommodation of preferences of different household members • Shopping practices • Purchase frequency (within product category) (as distinct from price responsiveness measures listed above) • Package size preference • Store and/or retail chain loyalty
Choosing a Primary Research Method Can the respondent answer accurately? (What someone consciously believes may differ from “deeper” opinions; beliefs about hypothetical products may not be well developed.) Does the question involve OPINIONS or BEHAVIOR? OPINIONS BEHAVIOR NO Can the relevant behavior be observed in the customer’s natural environment? PROJECTIVE METHODS YES EXPLORATORY or PRECISION research? YES NO SCANNER DATA (e.g., brand choice, impact of advertising, previous purchases, competing brands, demographics) EXPERIMENTATION (determine causality—e.g., impact of product design, advertising message) EXPLORATORY PRECISION OBSERVATION (e.g., how long does the shopper spend? What does he or she look at? Is anyone else involved?) PHYSIOLOGICAL (e.g., determine reactions, attention, arousal) INDIVIDUAL INTERVIEWS SURVEYS FOCUS GROUPS