Download
1 / 18
180 likes | 260 Views
A Major Qualifying Project By Derek Eggiman . Mean-Value Method of Lateral Force Calibration. Introduction. Acknowledgments. We would like to thank Sigma-Xi for generously funding this project. We would also like to thank Professor Nancy Burnham and Dr. Deli Liu. Atomic Force Microscope.

E N D
A Major Qualifying Project By Derek Eggiman Mean-Value Method of Lateral Force Calibration
Acknowledgments • We would like to thank Sigma-Xifor generously funding this project. • We would also like to thank Professor Nancy Burnham and Dr. Deli Liu.
Many studies assume a functional form for friction, f=μ(N+A). • Other methods calibrate as a function of load. • Repeated scans • Excess tip wear. • Other methods require special equipment or are far to complicated and time consuming. • Want quick, in-situ method. Current Problems in LFM Calibration
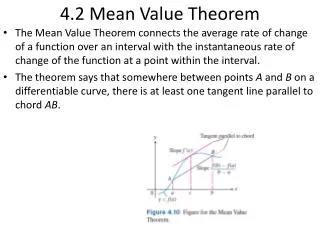
MethoDology • Equilibrium equations depend on direction of motion (Vx) and angle (θ). • Taking the average value of scans in opposite directions over the same surface results in cancelations. • Flat-avg= Floadtan(θ) or • Vlat-avg= αFloadtan(θ)
Samples:Tested • Piano wire • Steel rod • Solder spheres • 1.588 mm diameterSi3N4 ball bearings http://www.satotekkou.co.jp/en/product/img/ceramic-p04.jpg
Experimental Difficulties • Finding a sufficiently smooth surface • Lack of lateral force sensitivity • Crosstalk of lateral and normal force signals
Obtained by taking a complete image of 256X256 data points in a 27 X 27 (μm) scan range. • Then taking the mean value along the y axis and using this data to perform our analysis. • Plotted the mean value of: • Topography (μm) • LFM Forward • LFM Reverse Full scan Mean-value analysis
Mean value of 256 X 256 point scan shows high degree of linearity. R2=0.961. Successfully derived proof of concept. Work will be continued by SaontiChakraborty and published in a peer reviewed journal. Conclusions
Questions? http://www.phdcomics.com/comics/archive.php?comicid=771