Download
1 / 26
260 likes | 548 Views
Western Australia. A Statistical Overview 2010-11. Contents. 1. Department of State Development. The Department provides leadership to drive responsible development for Western Australia’s future. www.dsd.wa.gov.au. 2. Western Australia: 2010-11.

E N D
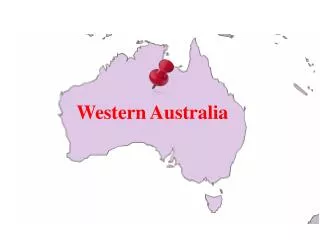
Western Australia A Statistical Overview 2010-11
1. Department of State Development The Department provides leadership to drive responsible development for Western Australia’s future. www.dsd.wa.gov.au
3. PopulationWestern Australia’s population totalled 2.31 million in 2010, 2.1% (47,400) higher than in the previous year. Population growth slowed from 3.4% in 2008 and 2.4% in 2009.
4. EconomyThe Western Australian economy was valued at $217 billion in 2010-11, 3.5% higher than in 2009-10 in real terms. Australia’s GDP grew 2.1% in 2010-11.
5. IndustryMining was the main contributor to the Western Australian economy in 2010-11, valued at $71 billion or 33% of GSP, followed by construction ($25 billion or 12%) and manufacturing ($12 billion or 5%).
6. ResourcesWestern Australia produced $101 billion of minerals and petroleum in 2010-11. Iron ore made up the largest share of production ($57 billion), followed by crude oil and condensates ($12 billion), LNG ($9 billion) and gold ($8 billion).
6. ResourcesThe value of Western Australia’s minerals and petroleum production rose 39% ($29 billion) in 2010-11. The largest increases were in the production of iron ore ($22 billion), crude oil and condensate ($2.5 billion), LNG ($1.7 billion), gold ($1.6 billion) and copper, lead and zinc ($1.4 billion).
6. ResourcesPetroleum exploration expenditure in Western Australia totalled $2.4 billion in 2010-11, 3% lower than in the previous year. Iron ore (18%) and gold (30%) exploration expenditure rose in 2010-11.
7. InvestmentPrivate new capital expenditure in Western Australia totalled $37 billion in 2010-11, 21% higher than in the previous year. Mining industry investment rose 29% to $28 billion in 2010-11.
7. InvestmentEngineering construction activity in Western Australia totalled $25 billion in 2010-11, 8% higher than in the previous year. There was $66 billion of engineering construction work in the pipeline at the end of 2010-11, mainly for the Gorgon LNG project.
7. InvestmentThere was $138 billion of major resource projects under construction or committed in Western Australia in September 2011 and a further $169 billion under consideration.
8. International tradeWestern Australia was the largest merchandise exporter in Australia in 2010-11, contributing 46% ($113 billion) of national exports.
8. International tradeThe value of Western Australia’s merchandise exports totalled $113 billion in 2010-11, 33% higher than in the previous year. The State’s merchandise imports fell 7% to $26 billion in 2010-11.
8. International tradeIron ore accounted for 51% of Western Australia’s exports in 2010-11, valued at $57 billion. Gold (12%), crude oil and condensate (10%), LNG (7%), nickel (4%) and alumina (3%) were other major export commodities in 2010-11.
8. International trade Petroleum accounted for 25% of Western Australia’s imports in 2010-11, valued at $6.4 billion. Gold (15%), industrial machinery and equipment (12%) and road vehicles (10%) were other major import commodities in 2010-11.
8. International tradeChina was Western Australia’s largest export market in 2010-11 ($47 billion or 42%), followed by Japan ($21 billion or 19%). China was the State’s largest source of imports in 2010-11 ($3 billion or 13%).
8. International tradeWestern Australia’s services exports rose 1.3% to $5.4 billion in 2010-11. The State’s services imports rose 0.8% to $8.9 billion in 2010-11.
9. Labour marketWestern Australia’s unemployment rate was 4.2% at the end of 2010-11, higher than the rate at the end of 2009-10 (4.1%). Australia’s unemployment rate was 5.0% at the end of 2010-11.
9. Labour marketThere were 1.21 million people employed in Western Australia in 2010-11. Construction was the largest employing industry (133,500), ahead of retail trade (127,200) and health care and social assistance (118,300).
9. Labour marketWestern Australia’s average annual earnings rose 7% ($5,070) to $78,385 in 2010-11, higher than the national rise of 4% ($2,883) to $69,417.
10. PricesPerth’s consumer price index rose 2.9% in 2010-11, lower than the national rise of 3.1%. Perth’s rate of inflation in 2010-11 accelerated from 2.5% in 2009-10, the first acceleration since 2005-06.
10. PricesWestern Australian exporters received higher prices for metal ores (43%), LNG (22%), crude oil (15%) and gold (13%) in 2010-11.
11. Global economic growth forecastsThe International Monetary Fund (IMF) has forecast 4.0% growth for the world economy in 2012. China’s economy is expected to grow 9.0% and Japan’s economy is expected to grow 2.3% in 2012.
12. Explanatory notes • Statistical information in this presentation is sourced from the Australian Bureau of Statistics (ABS), Western Australian Department of Mines and Petroleum, Western Australian Department of State Development and the International Monetary Fund. • Readers are encouraged to view the explanatory notes in related ABS publications for more detailed information about the statistics. • ABS industry statistics are based on the 2006 Australian and New Zealand Standard Industry Classification. • ABS trade statistics are based on the Standard International Trade Classification. • Data on Western Australia’s gold trade should be interpreted with caution. The restructuring of the Australian gold refining industry lead to large quantities of gold being imported into the State for further refining before being re-exported. As a result, gold exports from Western Australia are much higher than the State’s gold production. • Dollar amounts are expressed in Australian dollar and nominal (current price) terms, unless otherwise stated.