Download
1 / 25
250 likes | 336 Views
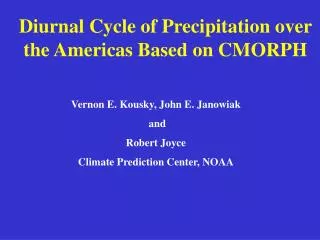
Combining CMORPH with Gauge Analysis over 2010.05.20. Objective:. To report our recent progress on the development of a new technique to remove bias in the CMORPH high-resolution precipitation estimates over land on daily time scale and

E N D
Objective: To report our recent progress on the development of a new technique to remove bias in the CMORPH high-resolution precipitation estimates over land on daily time scale and to combine the bias corrected CMORPH with gauge analysis
Data: CMORPH: Currently operational version CMORPH 2000 – 2009 (in process of backward extension to Jan.1998) Integrated to 0.25olat/lon / daily Gauge Data CPC Unified Global Daily Gauge Analysis Interpolation of QCed gauge reports from ~30K stations 1979 – present Integrated to 0.25olat/lon from its original grid of 0.125o lat/lon resolution Analysis released on 0.5olat/lon grid over globe and 0.25olat/lon over CONUS
CMORPH Bias [1]Global Distribution 2000-2009 10-yr annual mean precip CMORPH captures the spatial distribution patterns very well BIAS exists Over-estimates over tropical / sub-tropical areas Under-estimates over mid- and hi-latitudes
CMORPH Bias [2]Time Scales of the Bias Bias over CONUS Bias presents substantial variations of seasonal (top), sub-monthly (middle), and year-to-year (bottom) time scales
CMORPH Bias [3]Range Dependence Bias as a function of CMORPH Rainfall Intensity over CONUS Bias exhibits strong range dependence
Bias Correction [1]General Strategy Seasonal / Year-to-year variations in bias correction coefficients change with time Sub-monthly variations in bias against sub-monthly gauge data Range-dependence in bias PDF matching
Bias Correction [2]Conceptual Model for Daily Precip. Over China • Principal • Match the PDF of the CMORPH against that of daily gauge to define and remove the bias, assuming PDF of the gauge analysis represents that of the truth • Implementation • Collect co-located pairs of gauge and CMORPH over grid boxes with >=1 reporting stations within a spatial window centering at the target grid box and a time period ending at the target date (30-day); • A minimum of 300 pairs to ensure stability of PDFs • Define PDF for the CMORPH and gauge analysis
Bias Correction [4]Spatial Patterns of Remaining Biases • bias patterns caused by large spatial domain required to collect data pairs of sufficient number
Bias Correction [5]Global Implementation for Daily Bias Correction • Step 1: Correction using Historical Data • Establish PDF matching tables for each 0.25olat/lon grid for each calendar date using data over nearby regions and over a period of +/- 15 days centering at the target date • Step 2: Correction using Real-Time Data • Perform PDF matching using data over a 30-day period ending at the target date • Step 3: Combining Results from HIS/RT • Linear combination with weights inversely proportional to the error variance
Bias Correction [6]Correction Using Real-Time Gauge Data • Data pairs collected from a very large domain over gauge sparse areas (e.g. Africa)
Bias Correction [7]Correction Using Historical Gauge Data • Spatial patterns of remaining bias much smaller
Bias Correction [8]Defining Error for Bias-Corr. CMORPH Using HIS/RT Data • Assuming error variance proportional to the rainfall intensity and inversely proportional to the size of data collecting domain • Determining the coefficients using real data over the 10-yr period
Bias Correction [9]Bias Corrected CMORPG Using HIS/RT Data • Bias corrected CMORPH with estimated error
Performance [2]Remaining Bias & Gauge Network • Remaining ‘bias’ appears over gauge sparse regions • • Less desirable correction due to large data collection domain • Poor quality in the gauge analysis
Performance [3]Correlation of Daily Precip. Over the 10-yr Period
Combining Gauge and CMORPH [ 1 ] Combining Bias-corrected Satellite Estimates with Daily gauge over the Several Regions This is only possible for several regions due to different daily ending time in the gauge reports Africa (06Z) CONUS/MEX (12Z) S. America (12Z) Australia (00Z) China (00Z) Combining the bias-corrected CMORPH with gauge observations through the Optimal Interpolation (OI) over selected regions where gauge observations have the same daily ending time in which the CMORPH and gauge data are used as the first guess and observations, respectively
Prototype algorithm is developed and test products are constructed for the gauge-satellite merged global precipitation analyses • Two sets of gauge-satellite precipitation analyses • Bias-corrected Satellite Estimates • Global • 8kmx8km; 30-min • 1998 to the present • Gauge-satellite combined analyses • Regional • 0.25olat/lon; daily • 1998 to the present • Unified gauge – satellite precipitation analyses useful for climate monitoring, model verifications, hydrological studies, et al. Summary