Download
1 / 22
220 likes | 309 Views
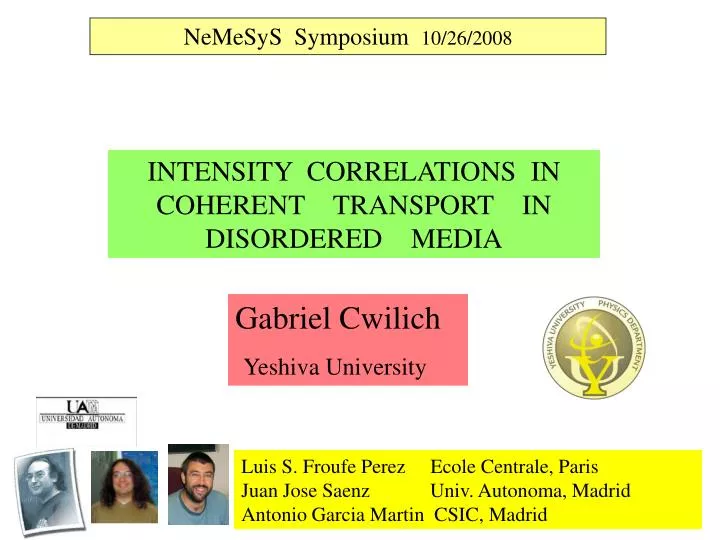
NeMeSyS Symposium 10/26/2008. INTENSITY CORRELATIONS IN COHERENT TRANSPORT IN DISORDERED MEDIA. Gabriel Cwilich Yeshiva University. Luis S. Froufe Perez Ecole Centrale, Paris Juan Jose Saenz Univ. Autonoma, Madrid

E N D
NeMeSyS Symposium 10/26/2008 INTENSITY CORRELATIONS IN COHERENT TRANSPORT IN DISORDERED MEDIA Gabriel Cwilich Yeshiva University Luis S. Froufe Perez Ecole Centrale, Paris Juan Jose Saenz Univ. Autonoma, Madrid Antonio Garcia Martin CSIC, Madrid
OUTLINE • Coherent transport • Correlations • Experimental motivation • Transport Random Matrix Theory • Numerical Results • Conclusions
COHERENT PROPAGATION Elastic scattering Phase preserved Direction randomized over l l < L < lin l No need for low T !! No need for miniaturization !! Weak Localization Universal Conductance Fluctuations Berkovits & Feng, Phys Rep 238 (1994) Mesoscopic Physics of electrons and Photons E. Akkermans and G. Montambaux
CORRELATIONS Feng, Kane, Lee & Stone PRL 61, 834 (1988) Diagrammatic theory for I - I correlations g = (e2/h) Sab Tab (Landauer) Tab = | tab |2 Transmission: Ta = Sb Tab ;g = Sab Tab <g> = N<Ta> = N2 < Tab > follows from isotropy
No crossing, one crossing, two crossings prop to 1, 1/g , 1/g2 Caba’b’ = <dTab dTa’b’> = C1 + C2 + C3 C1 is essentially (FE )2 (square of field correlation) This leads to interesting experimental effects: In transmission: Caba’b’ = <Tab> <Ta’b’>{ C1 daa’ dbb’ + C2 (daa’ +dbb’) + C3 }
Fluctuations of the intensity at one speckle pattern(Shapiro, PRL 86) SHORT RANGE Fluctuations in total transmission (Stephen & GC, PRL 87). LONG RANGE Fluctuations in g UCF (Feng et al, PRL88) INFINITE RANGE Caba’b’ = <Tab> < Ta’b’>{ C1daa’dbb’ + C2 (daa’ +dbb’) + C3}
The experiment Spatial-Field Correlation: The Building Block of Mesoscopic Fluctuations P. Sebbah,B. Hu,A. Z. Genack,R. Pnini,and B. Shapiro Similar results in 2003-2004 for polarization Van Tiggelen
Microwaves: Tumbles system and averages ~ 700 configurations Places a source at 50 positions on the input face, and detector at the output face. r R 7.5 cm 100 cm Measures E(r,R) I(r,R) = |E(r,R)|2
C1(Dr,d) = (0.002) C1(Dr,0) C1 is a product of two identical functions of the source and detector [C- C1](Dr, DR) falls to ½ when one of the variables increases beyond a certain value. C2 is a sum of the same two identical functions of the source and detector C(Dr,0) = C(0,DR) C1(Dr,0) = C1(0,DR) There is complete symmetry source-detector
THE RMT APPROACH The coefficients of the scattering matrix have to verify the physical constraints Flux conservation S S+ = 1 Also: S = St (if there is no time reversal breaking mechanism)
Expand in eigenfunctions of the clean cavity Quasi – 1D - geometry Transverse Longitudinal Statistical averages
Transport RMT theory to evaluate the averages (Mello, Beenakker) polar decomposition Unitary matrices Key idea: maximum entropy All information about transport is contained in the t (transport eigenvalues) The average over transmission coefficients factorizes in a geometric part which is independent of the transport regime ISOTROPY
e.c.a One can prove results for the averages of the ui <( uijn )(uij’n’)*> = (1/N) djj’ dnn’ Indeed the symmetry source-detector; and the product (C1) and the sum (C2) have been reproduced. Also C3 = C1-1
In the limit of large N Torres and Saenz, J.Phys. Soc. Japan 73, 2182 FIELD CORRELATION Comparison between the large N limit and a solution on a cavity of cross section W with W/(l/2) = 41/2 ( N= 20, g 1.2)
Intensity correlations The correlations for sources at DR12=0 and DR12>> l, comparing our expressions with the numerical simulation Not perturbative results
s defined as Monte Carlo method Froufe-Perez et al , PRL (2003) Dependence of correlations with the length of the system Dorokhov and Mello-Pereyra-Kumar introduced an equation for the joint distribution of the transport eigenvalues tas a function of the length s = L/l (Fokker-Planck) Exact solution only for b=2 , but there are approximations in the localized case s>>N, and the diffusive limit 1<<s<<N.
Using our numerical values for C(Dr,DR) we adjust with the RMT expression obtained and find C1, C2, C3 at different scales The continuous line is the DMPK solution C2 goes negative at small scales s = L/l Dependence of correlations with the length of the system
Conclusions • RMT is a useful tool to understand transport properties, in particular space correlations, for specific geometries. • The structure of the correlations is independent of the transport regime. • We get good agreement with numerical simulations. • We can predict dependence of the correlations with length of the cavity, which can be tested. More details in: Phys Rev E74, 045603(R) , 2006 Physica A386, 625, 2007