Download
1 / 1
10 likes | 118 Views
ba. g. 2. f. Background cloud cover. GOES VIS & 3.9 um. Ñ. F. -. F. -. F. =. 2. A. y. a. A. g. ~. ~. ~. Synoptic weather chart. -. F. -. -. A. (. N. v. ). (. N. u. ). METAR. GOES IR. y. x. a. l. b. ba. ~. 2. f. ~. ~. +. z. -. -. b.

E N D
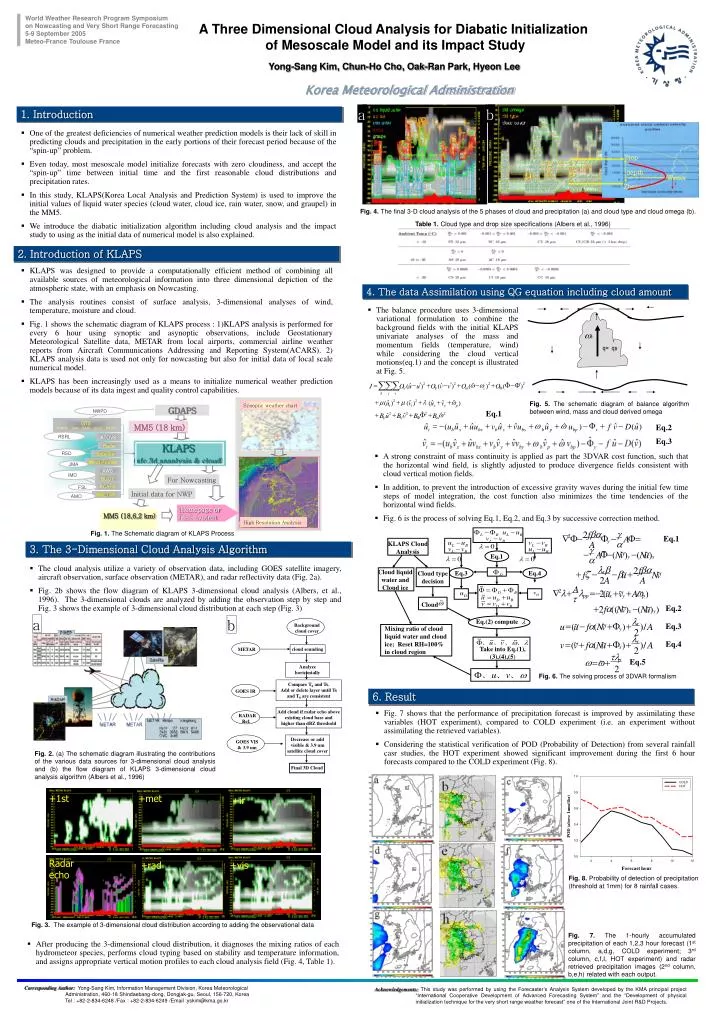
ba g 2 f Background cloud cover GOES VIS & 3.9 um Ñ F - F - F = 2 A y a A g ~ ~ ~ Synoptic weather chart - F - - A ( N v ) ( N u ) METAR GOES IR y x a l b ba ~ 2 f ~ ~ + z - - b + x f u N v A A 2 A ~ ~ ~ Ñ l + l = - + + w 2 2 ( u v A ) pp x y p t ~ ~ + a - 2 f (( N v ) ( N u ) ) 1. Introduction q= qs x y l ~ ~ = - a + F + x u ( u f ( N v ) ) / A y 2 l • One of the greatest deficiencies of numerical weather prediction models is their lack of skill in predicting clouds and precipitation in the early portions of their forecast period because of the “spin-up” problem. • Even today, most mesoscale model initialize forecasts with zero cloudiness, and accept the “spin-up” time between initial time and the first reasonable cloud distributions and precipitation rates. • In this study, KLAPS(Korea Local Analysis and Prediction System) is used to improve the initial values of liquid water species (cloud water, cloud ice, rain water, snow, and graupel) in the MM5. • We introduce the diabatic initialization algorithm including cloud analysis and the impact study to using as the initial data of numerical model is also explained. Ztop ~ ~ y = + a + F + v ( v f ( N u ) ) / A x 2 depth tl Wmax ~ p w = w + Zbase 2 High Resolution Analysis GDAPS NWPD GTS SYNOP , SHIP, TEMP , BUOY , METAR MM5 (18 km) å å å ˆ ¢ ¢ ¢ = - + - + w - w + F - F 2 2 ' 2 2 ˆ ˆ ˆ J O ( u u ) O ( v v ) O ( ) O ( ) w F V V c RSRL ATOVS k j i = - + + + + w + w - F + - ˆ ˆ ˆ ˆ ˆ ˆ ˆ ˆ ˆ u ( u u u u v u v u u u ) f v D ( u ) + m + m + l + + w 2 2 ˆ KLAPS (sfc,3d ananlysis & cloud) ˆ ˆ ˆ ˆ ( u ) ( v ) ( u v ) Radar t b x bx b y by b p bp x t t x y p RSD (1) Satellite ˆ + + + F + w 2 2 2 2 ˆ ˆ ˆ B u B v B B F w V V Wind Profiler JMA AWS IMD For Nowcasting BUOY ACARS FSL Initial data for NWP KMETAR AMO Homepage or FAS system MM5 (18,6,2 km) Fig. 1. The Schematic diagram of KLAPS Process cloud sounding Analyze horizontally Compare T0 and Ts. Add or delete layer until Ts and T0 are consistent Add cloud if radar echo above existing cloud base and higher than dBZ threshold RADAR Ref. Decrease or add visible & 3.9 um satellite cloud cover Fig. 2. (a) The schematic diagram illustrating the contributions of the various data sources for 3-dimensional cloud analysis and (b) the flow diagram of KLAPS 3-dimensional cloud analysis algorithm (Albers et al., 1996) Final 3D Cloud +1st +met +ir Fig. 8. Probability of detection of precipitation (threshold at 1mm) for 8 rainfall cases. Radar echo +rad +vis Fig. 3. The example of 3-dimensional cloud distribution according to adding the observational data Fig. 7. The 1-hourly accumulated precipitation of each 1,2,3 hour forecast (1st column, a,d,g, COLD experiment; 3rd column, c,f,I, HOT experiment) and radar retrieved precipitation images (2nd column, b,e,h) related with each output. A Three Dimensional Cloud Analysis for Diabatic Initialization of Mesoscale Model and its Impact Study World Weather Research Program Symposium on Nowcasting and Very Short Range Forecasting 5-9 September 2005 Meteo-France Toulouse France Yong-Sang Kim, Chun-Ho Cho, Oak-Ran Park, Hyeon Lee Korea Meteorological Administration a b Cu Cu Cu Fig. 4. The final 3-D cloud analysis of the 5 phases of cloud and precipitation (a) and cloud type and cloud omega (b). Table 1. Cloud type and drop size specifications (Albers et al., 1996) 2. Introduction of KLAPS • KLAPS was designed to provide a computationally efficient method of combining all available sources of meteorological information into three dimensional depiction of the atmospheric state, with an emphasis on Nowcasting. • The analysis routines consist of surface analysis, 3-dimensional analyses of wind, temperature, moisture and cloud. • Fig. 1 shows the schematic diagram of KLAPS process : 1)KLAPS analysis is performed for every 6 hour using synoptic and asynoptic observations, include Geostationary Meteorological Satellite data, METAR from local airports, commercial airline weather reports from Aircraft Communications Addressing and Reporting System(ACARS). 2) KLAPS analysis data is used not only for nowcasting but also for initial data of local scale numerical model. • KLAPS has been increasingly used as a means to initialize numerical weather prediction models because of its data ingest and quality control capabilities. 4. The data Assimilation using QG equation including cloud amount • The balance procedure uses 3-dimensional variational formulation to combine the background fields with the initial KLAPS univariate analyses of the mass and momentum fields (temperature, wind) while considering the cloud vertical motions(eq.1) and the concept is illustrated at Fig. 5. Fig. 5. The schematic diagram of balance algorithm between wind, mass and cloud derived omega Eq.1 Eq.2 Eq.3 • A strong constraint of mass continuity is applied as part the 3DVAR cost function, such that the horizontal wind field, is slightly adjusted to produce divergence fields consistent with cloud vertical motion fields. • In addition, to prevent the introduction of excessive gravity waves during the initial few time steps of model integration, the cost function also minimizes the time tendencies of the horizontal wind fields. • Fig. 6 is the process of solving Eq.1, Eq.2, and Eq.3 by successive correction method. Eq.1 KLAPS Cloud Analysis 3. The 3-Dimensional Cloud Analysis Algorithm Eq.1 • The cloud analysis utilize a variety of observation data, including GOES satellite imagery, aircraft observation, surface observation (METAR), and radar reflectivity data (Fig. 2a). • Fig. 2b shows the flow diagram of KLAPS 3-dimensional cloud analysis (Albers, et al., 1996). The 3-dimensional clouds are analyzed by adding the observation step by step and Fig. 3 shows the example of 3-dimensional cloud distribution at each step (Fig. 3) Cloud liquid water and Cloud ice Eq.3 Eq.4 Cloud type decision Cloud Eq.2 a b Eq.(2) compute Eq.3 Mixing ratio of cloud liquid water and cloud ice;Reset RH=100% in cloud region Eq.4 Take into Eq.(1), (3),(4),(5) Eq.5 Fig. 6. The solving process of 3DVAR formalism 6. Result • Fig. 7 shows that the performance of precipitation forecast is improved by assimilating these variables (HOT experiment), compared to COLD experiment (i.e. an experiment without assimilating the retrieved variables). • Considering the statistical verification of POD (Probability of Detection) from several rainfall casr studies, the HOT experiment showed significant improvement during the first 6 hour forecasts compared to the COLD experiment (Fig. 8). • After producing the 3-dimensional cloud distribution, it diagnoses the mixing ratios of each hydrometeor species, performs cloud typing based on stability and temperature information, and assigns appropriate vertical motion profiles to each cloud analysis field (Fig. 4, Table 1). Corresponding Author: Yong-Sang Kim, Information Management Division, Korea Meteorological Administration, 460-18 Shindaebang-dong, Dongjak-gu, Seoul, 156-720, Korea Tel : +82-2-834-6248 /Fax : +82-2-834-6249 /Email :yskim@kma.go.kr Acknowledgements: This study was performed by using the Forecaster’s Analysis System developed by the KMA principal project “International Cooperative Development of Advanced Forecasting System” and the “Development of physical initialization technique for the very short range weather forecast” one of the International Joint R&D Projects.