Download
1 / 31
310 likes | 404 Views
Ion Beam Analysis of Gold Flecks in a Foam Lattice F E Gauntlett, A S Clough Physics Department, University of Surrey, Guildford, GU2 7XH, UK. Ion Beam Characterisation of Gold-Loaded Foam Sample. 1mm.

E N D
Ion Beam Analysis of Gold Flecks in a Foam Lattice F E Gauntlett, A S Clough Physics Department, University of Surrey, Guildford, GU2 7XH, UK
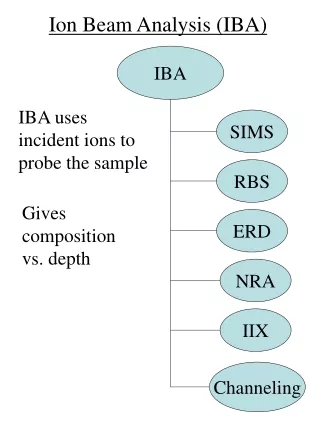
Ion Beam Characterisation of Gold-Loaded Foam Sample 1mm Low density foam cylinder (1mm diameter 1mm) loaded with tiny gold spheres (~ 5m diameter). Gold loaded foam cylinder is encased in a Kapton (polyimide) sleeve. 1mm At Surrey we have been asked to measure: • the total MASS of the gold flecks in the foam, • the average SIZE of the flecks, • the uniformity of DISTRIBUTION of the flecks. Techniques: Scanning Micro-PIXE Scanning Micro-RBS
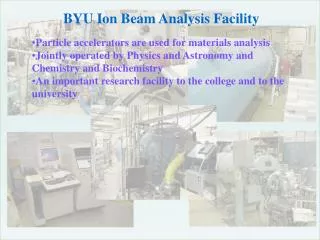
Surrey Ion Beam Centre Facility: 2 MV Tandetron Beamline: Scanning in vacuo proton microbeam
Detectors At Ep ~4MeV gold L X-rays (~10keV) are produced in abundance but they are attenuated by ~35% in a 5m diameter gold fleck. Gold K X-rays have energies of 66–78keV, so they are only attenuated by ~1%. However, their yield is very low. Thus we need to detect both: K X-rays to determine the overall quantity of gold present and L X-rays to determine from the attenuation the average size of the flecks. Hence we use Amptek CdTe detectors which are ~100% efficient between 10-70keV. We also detect Backscattered protons with 100mm2 ORTEC ULTRA detectors with a 300m depletion layer.
Detectors in Sample Chamber We use two detectors in both cases to obviate any instrumental asymmetries.
A Sample in Carbon Blocks and Beam Setting-Up Plate (View of Vertical Sample Holder) 2m thickGold Foil (Comparison) Foam Sample Carbon Blocks Scintillator Copper Grid
Sleeve Copper Sample In Chamber View of sample in the chamber through microscope at 135 to beam direction:
Spectra! The PIXE spectrum, contains gold L X-rays, also a lot of copper. The Backscatter spectrum, contains carbon, oxygen and gold. Copper K X-rays Gold L X-rays Counts Carbon Counts Energy, keV Oxygen Gold Energy, keV The microbeam is raster scanned over the scan area, recording the position associated with each event. We can draw 2D maps corresponding with specific features (i.e. counts within a chosen energy window) on the spectra…
MAPS…. Max. Counts Min. Counts Carbon Backscatters, TOP Gold L X-rays, RIGHT Gold L X-rays, LEFT Carbon Backscatters, BOTTOM
RBS Detector Spectrum from Foam Containing Gold Flecks Carbon Edge Counts Oxygen Edge Gold Continuum(!) Energy, keV
Gold Continuum The gold continuum is sloping, without the sharp edge typical of backscatter spectra from uniform layers: Counts Energy, keV
to detector 165 protons How Do We Explain the Shape of the Gold Continuum? It is likely that at most only 1 gold fleck is in the path of a proton. (Assuming gold flecks are 5m in diameter and have a total mass of ~15% of the foam mass – an upper estimate – the number of gold flecks in a cylinder is ~700 and the areal ratio (sum of cross sectional areas of gold spheres/area of foam cylinder) ~7x10⁻² i.e. 93% of the time protons in the beam incident on the foam go through the foam completely missing any gold flecks.)
Gold Continuum Highest Energy At the highest backscatter detected energy (4.046 MeV) only the front surface nuclei of any gold fleck at the front of the foam (left on this figure) will contribute.
In Gold Continuum At lower and lower backscatter detected energies, more and more combinations of protons backscattered from within flecks at various depths will contribute.
Example Au Low E Au Medium E Counts Au High E Energy, keV
Carbon Counts Oxygen Gold Energy, keV Limiting Depth The Limiting Depth is when the backscatter energy from the front of a Au fleck at that depth is equal to the backscatter energy from Oxygen at the front of the foam (3.221MeV). Limiting Depth For 4MeV protons DL~0.7mm. Thus to detect all the gold flecks in the full length of the foam cylinder - 1mm - with 4MeV protons we must use X-rays.
Can we get an estimate of the gold mass? • Re-run spectra offline, screening out the wire • Normalisation • Calculations • Validation of Technique
Gold and Carbon Maps from Backscatter Spectra Top Bottom Gold (Backscatters) Carbon (Backscatters)
Gold Maps from PIXE Spectra Right Left Gold K X-rays Gold L X-rays
Au L X-rays 10 Au K X-rays Counts Counts Energy, keV 0 Energy, keV 70 90 60 80 Energy, keV New Spectra Counts Energy, keV
Can We Get an Estimate of the Gold Mass? • Re-run spectra offline, screening out the wire • Normalisation • Calculations • Validation of Technique
Normalisation with Protons Backscattered from Carbon Gold Foil NC/AC Sample
Can we get an estimate of the gold mass? • Re-run spectra offline, screening out the wire • Normalisation • Calculations • Validation of Technique
K X-rays We then get an excellent measure of the beam charge ratio between the foam sample run and the foil run: We can use this to relate the gold K X-ray scatters from the gold flecks to those from the foil: where MAu is the mass of gold in the sample, MAuF is the mass of gold foil included in the scan and the differential cross-sections are evaluated at the mean proton energies ES , EF in the sample and foil respectively. We find MAu= 3.2 0.4g
L X-rays And for the L X-rays: From this equation, using the gold mass MAu from the K X-ray measurements, we can find a characteristic attenuation length l, for the L X-rays in the gold. This can be related to the gold diameter D, using an expression derived by Dirac, for the mean chord length in any one direction in a sphere D = 3 l: We find D = 5.5 0.6 m
Can We Get an Estimate of the Gold Mass? • Re-run spectra offline, screening out the wire • Normalisation • Calculations • Validation of Technique
Experimental Validation Using a Complementary Technique • An alternative technique to measure the mass of gold flecks in foam is XRF (rhodium target x-ray tube). However this can only produce L X-rays from gold, eliminating the technique as a candidate for measuring 5 m diameter flecks. • So, to check our technique, we did measurements on a foam sample containing a similar mass of gold but having fleck diameters of ~0.5 m. • In these sub-micron flecks L X-ray attenuation is of order 1%! From XRF measurements the gold mass is: MAu = 4.1 0.8 g From our K X-ray measurements we find: MAu = 3.8 0.7 g From our L X-ray measurements we find: MAu = 4.4 0.5 g All three measurements are compatible.
Backscatter from Sub-Micron Gold Flecks • Another interesting feature of the measurement on the 0.5 m flecks is the Backscatter spectrum – which, at the high backscatter end, looks like one you would expect from a low density gold film. Counts Energy, keV
Estimate of mass from RBS Measurements Because of energy loss in the polyimide sleeve the gold backscatter spectrum above the Oxygen edge is representative of only a fraction, an elliptic cylinder, of the foam volume. From this though we can calculate the gold density. Assuming a uniform distribution of the gold we can then infer the mass by multiplying by the full foam cylinder volume. We find D = 5.0 0.5 g BUT: This probably over-estimates the mass due to slight deformations of the cylindrical shape.
Conclusions We have successfully: • devised a novel technique for characterising gold flecks in foam, • measured the mass of the gold flecks loaded within the foam, • measured the average fleck size, • observed their spatial distribution in 2D maps, • validated the technique. This work is continuing using an updated version of one of the CdTe detectors. This will eliminate much of the background electronic noise on the spectra of the older detector and improve the statistical accuracy.
Any Questions? Thank you for listening!