Download
1 / 85
890 likes | 1.11k Views
CHAPTER 21. Municipal Solid Waste: Disposal and Recovery. An introduction to municipal solid waste. Danehy Park is in North Cambridge, Massachusetts Its 50 acres hosts thousands of people A red light in the bathroom warns if methane has built up

E N D
CHAPTER 21 Municipal SolidWaste: Disposaland Recovery
An introduction to municipal solid waste • Danehy Park is in North Cambridge, Massachusetts • Its 50 acres hosts thousands of people • A red light in the bathroom warns if methane has built up • The park is built on an old landfill that was once a blight on the neighborhood • In the 1970s and 1980s, closing old landfills created a “solid waste crisis” that turned out to be temporary • Many have been converted to parks, golf courses, and nature preserves • We are running out of space to put all of our garbage
Solid wastes: landfills and combustions • Municipal solid waste (MSW): total of all materials (trash, refuse, garbage) thrown away from homes and small businesses • It is collected by local governments • It is different from hazardous waste and nonhazardous industrial waste • Nonhazardous industrial waste: generated by industries • Demolition and construction wastes, agricultural and mining wastes, sewage sludge, industrial wastes • States, not the EPA, oversee these wastes
Disposal of municipal solid waste • The amount of MSW generated in the U.S. is increasing • More people, changing lifestyles, excessive packaging • In 1960, the average MSW was 2.7 lbs/person/day • In 2007: 4.6 lbs/person/day • In 2007, the U.S. generated enough garbage to fill 96,000 garbage trucks/day • We generate huge amounts of MSW and it is harder to dispose of in an environmentally sound and healthy way • MSW varies depending on the generator, neighborhood, and time of year
Electronic Waste: A Growing Problem • E-waste consists of toxic and hazardous waste such as PVC, lead, mercury, and cadmium. • The U.S. produces almost half of the world's e-waste but only recycles about 10% of it. Figure 22-4
Whose job? • Many local governments are responsible for collecting and disposing of MSW • They own trucks and hire workers • Or contract with a private firm • Who pays for the cost of waste pickup? • Taxes • Pay-as-you-throw: charges by the amount of trash • Collectors bill households • State and federal regulations begin to apply at disposal
Past sins • Until the 1960s MSW was burned and buried in dumps • Smoldering dumps smelled and attracted flies and rats • Incineration (combustion facilities): burn waste completely • May cause air pollution • Open dumps and incinerators were phased out • Public pressure and air pollution laws • Replaced by landfills • In the last 10 years, landfills and combustion have declined • Recycling has increased • Patterns of disposal differ in countries
INTEGRATED WASTE MANAGEMENT • We can manage the solid wastes we produce and reduce or prevent their production. Figure 22-5
Landfills • Landfill: waste is put on or in the ground and covered with earth • Minimizing air pollution and vermin • But managers did not understand ecology, the water cycle, or products of decomposition • They did not have regulations to guide them • So landfills were put on any cheap land outside of town • Natural gullies, abandoned quarries, wetlands, old dumps
Secure landfills • Secure landfill: a reasonably safe landfill that is lined • It also has a leachate-removal system • It is monitored and properly capped • But the barriers are subject to damage and deterioration • Surveillance and monitoring systems are needed to prevent leakage
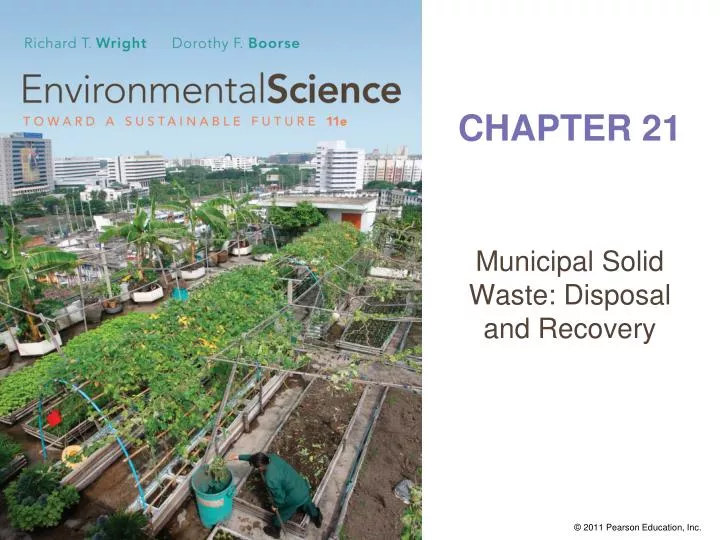
When landfill is full, layers of soil and clay seal in trash Topsoil Electricity generator building Sand Clay Methane storage and compressor building Leachate treatment system Garbage Probes to detect methane leaks Pipes collect explosive methane as used as fuel to generate electricity Methane gas recovery well Leachate storage tank Compacted solid waste Groundwater monitoring well Garbage Leachate pipes Leachate pumped up to storage tank for safe disposal Sand Synthetic liner Leachate monitoring well Sand Groundwater Clay and plastic lining to prevent leaks; pipes collect leachate from bottom of landfill Clay Subsoil Fig. 22-12, p. 532
Problems of landfills: leachate and groundwater pollution • Leaching: chemicals dissolve in and are transported by water • Leachate: water with various pollutants • A “witches brew” of pollutants • Organic matter, heavy metals, chemicals • Can enter groundwater aquifers • All states have, or will have, landfills contaminating groundwater • Florida has 145 sites on the Superfund list (sites where groundwater contamination threatens human health)
Problems of landfills: methane • Buried wastes undergo anaerobic decomposition • Producing biogas (methane, CO2 and hydrogen) • Biogas is highly flammable • Seeping horizontally through soil, it can enter homes and cause explosions • Seeping to the surface, it kills vegetation • Biogas can be captured, purified, and used as fuel • In 2008, commercial landfill gas produced electricity and gas for 1.4 million homes • Reducing greenhouse gas emissions and fossil fuel use
Problems of landfills: incomplete decomposition • Plastics in MSW resist decomposition • Petroleum-based polymers resist microbial digestion • Biodegradable plastic polymers have been developed • Using cornstarch, cellulose, lactic acid, soybeans • They are more expensive • They are used by organic manufacturing companies • Even biodegradable materials degrade very slowly • Newspapers buried 30 years ago are still readable • Decomposition requires water • But water produces toxic leachates
Problems of landfills: settling • Waste settles as it compacts and decomposes • Buildings have never been put on landfills • Where landfills have been converted to playgrounds and golf courses, shallow depressions or deep holes are created • Monitoring the facility and using fill to restore a level surface solve the problem
Improving landfills • The EPA upgraded siting and construction requirements • New landfills are sited on high, stable ground above the water table, away from airports • Water drains into a leachate-collection system • Tile, plastic liners, and compacted soil collect leachate • The fill is built up in the shape of a pyramid and capped with earthen material and soil and reseeded • The site is surrounded by groundwater monitors • Abandoned landfills can become recreational facilities • Attractive golf courses and wildlife preserves
Siting new landfills • Between 1988 and 2007, landfills decreased from 8,000 to 1,754 • The EPA does not think capacity is a problem • But people don’t want landfills near them • It is hard to find areas to build new landfills • Any potential site is met with protests and lawsuits • LULU (locally unwanted land use); NIMBY (not in my backyard); NIMTOO (not in my term of office) • BANANA (build absolutely nothing anywhere near anything)
Outsourcing • Undesirable consequences of the siting problem • Drives up costs of waste disposal • Inefficient and objectionable transfer to private landfills • Transfer of waste may occur across state or national lines • Resentment and opposition from citizens • 11 U.S. states export > 1 million tons/year (#1: New York) • 13 states import > 1 million tons/year (#1: Pennsylvania) • Desirable consequences of siting problems: it encourages recycling and stimulates combustion of MSW
Advantages of combustion • 89 U.S. facilities burn 32 million tons/year of MSW • A waste reduction process, not disposal • Ash must still be disposed of • Combustion reduces weight of trash by 70% and volume by 90% • Fly ash contains most of the toxic substances • It is landfilled • Bottom ash: is used as fill in construction or roadbeds • Converted to concrete
More advantages of combustion • No changes are needed in collection or people’s behavior • Two-thirds of combustion facilities are waste-to-energy (WTE) • Untreated MSW releases 35% as much energy as coal when burned • Producing electricity for 2.3 million homes • Wasted energy going to landfills equals 9.4 billion gallons of diesel oil/year • Many facilities add resource recovery • Separating and recycling materials before and after burning
Drawbacks of combustion • Air pollution: has decreased through strict regulations • Odor pollution: plants are isolated from residential areas • Facilities are expensive to build • Siting: facilities are located in industrial areas • Toxic ash must be disposed of in secure landfills • The facility must have a continuous supply of MSW • Agreements with municipalities decreases flexibility in waste management options • The process wastes energy and materials • Combine burning with recycling and recovery
An operating facility • A facility serving 1 million gets 3,000 tons of MSW/day • Waste comes in by rail and truck • Communities pay $65/ton tipping fees • Waste processing is efficient: 80% is burned for energy • 12% is recovered; 8% is landfilled • If 1 million tons of MSW are processed • 40,000 tons of metals are recycled • Electricity for 65,000 homes is generated • Opponents cite air pollution, traffic, and property values as concerns against WTE facilities
The Waste To Energy process • Incoming waste is inspected and recyclables are removed • Shredders reduce waste particles to 6 inches or less • Magnets remove metals for recycling • Waste is blown into boilers for burning • Water circulating through the boilers produces steam for electricity • Metals are separated from bottom ash • Combustion gases are treated to reduce emissions • Fly ash and bottom ash are taken to landfills
Costs of municipal solid-waste disposal • Costs of disposing of MSW are increasing • Design features of landfills • Expenses in acquiring sites and transportation • Tipping fees average $42/ton (but New York City’s is $263/ton—$1 billion/year!) • One consequence: illegal dumping • Some towns charge $5/bag for MSW, $1/tire, etc. • Wastes are appearing in many areas • Buildings put padlocks on dumpsters • Many states track down midnight dumpers
Better solutions: source reduction • Source reduction: reducing waste at its source • The best solution for domestic wastes • Designing, manufacturing, purchasing, or using materials to reduce the amount/toxicity of trash • U.S. waste has leveled off at 4.5 lbs/person • Due to lifestyle changes • Measured by measuring consumer spending, which reflects goods and products that become trash • In 2000, 55 million tons did not go into the waste stream
Examples • Reducing the weight of items • Steel cans are 60% lighter than they used to be • Reducing paper waste via electronic communication, data transfer, the Internet • Reusing durable goods: reselling items • eBay, Craigslist, Freecycle Network • Designing products to last longer and be easier to repair • Staying off of bulk mailing lists • Composting yard wastes
The recycling solution • More than 75% of MSW is recyclable • Primary recycling: the waste is recycled into the same material • Recycling newspapers into newspapers • Secondary recycling: waste is made into different products that may or may not be recyclable • Recycling newspapers into cardboard
Benefits of recycling • Recycling saves energy and resources • One ton of recycled steel saves 2,500 pounds of iron ore, 1,000 lbs of coal, 5,400 BTUs of energy • Recycling decreases pollution • Making recycled paper uses 64% less energy, creates 74% less air, and 35% less pollution • A recycling program that processes 1 ton of waste eliminates 620 lbs of CO2, 30 lbs of methane, 5 lbs of CO, 2.5 lbs of particulates
What gets recycled? • Paper (47%): paper, cardboard, insulation, or is composted • Glass (28%): new containers, fiberglass or used in highway construction (glassphalt) • Plastic (12%): carpet, clothes, irrigation drainage tiles, building materials, sheet plastic • Metals: recycling aluminum (39%) saves 90% of the energy to make cans from ore • Saves energy, creates jobs, reduces the trade deficit • Yard wastes (64%) are composted
Other items that are recycled • Textiles (17%): strengthen recycled paper products • Old tires (35%): incorporated into highway asphalt • Over 1 million tires/year are burned in combustion plants • People recycle out of environmental and economic motivations • The Global Recycling Network is an information exchange promoting recycling and ecofriendly products
Municipal recycling • Recycling is the most direct and obvious way to become involved in environmental issues • Almost every state has recycling goals, with varying degrees of success • 33.4% of MSW was recycled in 2007 • There is great diversity in recycling programs • Recycling centers, curbside recycling, incentives, etc.
Successful recycling programs • Have a strong incentive to recycle • PAYT charges, but no charges for recycling • Have mandatory regulations, with warnings or sanctions for violators • Offer curbside residential recycling • 60% of people in the U.S. have curbside programs • Have drop-off sites for large items (e.g., sofas) • Have ambitious, yet clear and feasible, recycling goals • Involve local industries • Have an experienced, committed recycling coordinator
Economics of recycling • Cities have different recycling rates • New York City, 16%; San Francisco, 70% • Recycling costs are often higher than alternatives • Markets fluctuate wildly; low tipping fees • Recycling critics say that recycling must pay for itself • Environmental assessments should compare energy costs of recycling with costs of landfill or combustion • Life cycle analysis: comparing energy costs of making products from recycled goods vs. from scratch
Recycling has taken a hit • The 2008–2009 recession caused demand for recyclable products to plummet • Berkeley, California received $200/ton for recyclables in 2008, but it got $35/ton in 2009 • But support for recycling is strong • Two-thirds of households will participate in curbside recycling • Even more recycle if a PAYT program exists or participants are rewarded • Dover, New Hampshire’s MSW went from 6 lbs/person (1991) to 2.3 lbs/person (1997)
Paper recycling • Newspapers: the most important item that is recycled • 78% of newspaper is recycled • What is meant by “recycled paper”? • Recycled paper: routinely recovered and rerouted back into processing • Postconsumer recycled paper is what’s important • It is almost impossible to tell recycled from virgin paper • The market is a critical factor in recycled paper • Is there a demand?
The market for recycled paper • The market for recycled paper fluctuates widely • During the late 1980s, municipalities had to pay to get rid of paper • In 1995, at $160/ton, paper was being stolen! • In 1996, the market collapsed • Cities had to pay to have paper hauled away • But it is still less expensive than paying tipping fees • There is a lively international trade in used paper • Forest-poor countries buy wastepaper