Download
1 / 37
370 likes | 483 Views
Climate Change: How did we get here and what do we do now?. Eugene S. Takle, PhD, CCM Professor of Atmospheric Science Department of Geological and Atmospheric Sciences Professor of Agricultural Meteorology Department of Agronomy Director, Climate Science Initiative Iowa State University

E N D
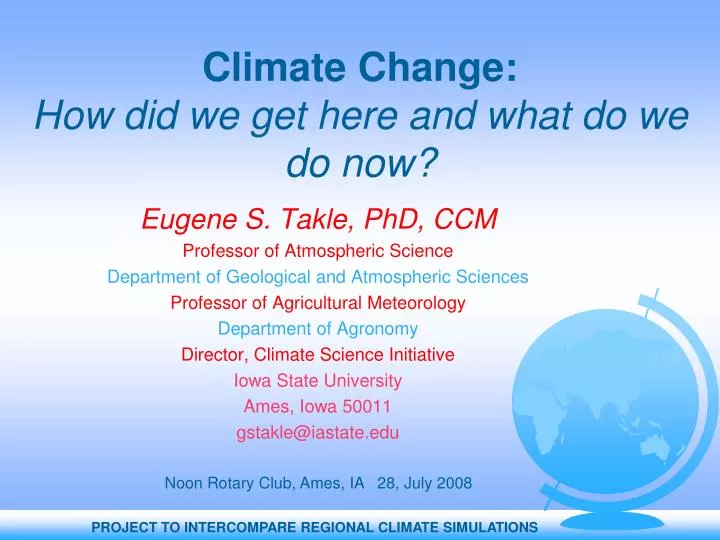
Climate Change: How did we get here and what do we do now? Eugene S. Takle, PhD, CCM Professor of Atmospheric Science Department of Geological and Atmospheric Sciences Professor of Agricultural Meteorology Department of Agronomy Director, Climate Science Initiative Iowa State University Ames, Iowa 50011 gstakle@iastate.edu Noon Rotary Club, Ames, IA 28, July 2008
Outline • Comparison of natural variability of climate and human induced climate change • Projections of future climate change • Impact of climate change on “regions suitable for rain-fed agriculture”, including the US Midwest • Climate change for Iowa and the Midwest: adaptation strategy Except where noted as personal views or from the Iowa Environmental Mesonet, all materials presented herein are from peer-reviewed scientific reports
CO2, CH4 and temperature records from Antarctic ice core data Source: Vimeux, F., K.M. Cuffey, and Jouzel, J., 2002, "New insights into Southern Hemisphere temperature changes from Vostok ice cores using deuterium excess correction", Earth and Planetary Science Letters, 203, 829-843.
CO2, CH4 and temperature records from Antarctic ice core data Source: Vimeux, F., K.M. Cuffey, and Jouzel, J., 2002, "New insights into Southern Hemisphere temperature changes from Vostok ice cores using deuterium excess correction", Earth and Planetary Science Letters, 203, 829-843. Pattern repeats about every 100,000 years Natural cycles
Carbon Dioxide and Temperature 2007 380 ppm
Carbon Dioxide and Temperature 2050 550 ppm
Carbon Dioxide and Temperature “Business as Usual” 950 ppm
Carbon Dioxide and Temperature “Business as Usual” 950 ppm ?
http://www.ncdc.noaa.gov/img/climate/research/2006/ann/glob_jan-dec-error-bar_pg.gifhttp://www.ncdc.noaa.gov/img/climate/research/2006/ann/glob_jan-dec-error-bar_pg.gif
Source: IPCC, 2001: Climate Change 2001: The Scientific Basis
Source: IPCC, 2001: Climate Change 2001: The Scientific Basis
http://www.ncdc.noaa.gov/img/climate/research/2006/ann/glob_jan-dec-error-bar_pg.gifhttp://www.ncdc.noaa.gov/img/climate/research/2006/ann/glob_jan-dec-error-bar_pg.gif
Natural and anthropogenic contributions to global temperature change (Meehl et al., 2004). Observed values from Jones and Moberg 2001. Grey bands indicate 68% and 95% range derived from multiple simulations.
Natural and anthropogenic contributions to global temperature change (Meehl et al., 2004). Observed values from Jones and Moberg 2001. Grey bands indicate 68% and 95% range derived from multiple simulations. Natural cycles
Natural and anthropogenic contributions to global temperature change (Meehl et al., 2004). Observed values from Jones and Moberg 2001. Grey bands indicate 68% and 95% range derived from multiple simulations. Not Natural
Natural and anthropogenic contributions to global temperature change (Meehl et al., 2004). Observed values from Jones and Moberg 2001. Grey bands indicate 68% and 95% range derived from multiple simulations. Highly Likely Not Natural Not Natural
Source: Jerry Meehl, National Center for Atmospheric Research
Energy intensive Reduced Consumption Energy conserving IPCC Fourth Assessment Report Summary for Policy Makers
Energy intensive Reduced Consumption Energy conserving The planet is committed to a warming over the next 50 years regardless of political decisions IPCC Fourth Assessment Report Summary for Policy Makers
Energy intensive Reduced Consumption Energy conserving Mitigation Possible Adaptation Necessary IPCC Fourth Assessment Report Summary for Policy Makers
Projected changes in precipitation between 1980-1999 and 2080-2099 for an energy-conserving scenario of greenhouse gas emissions IPCC 2007
Projected Changes* for the Climate of the Midwest Temperature • Longer frost-free period (high) • Higher average winter temperatures (high) • Fewer extreme cold temperatures in winter (high) • Fewer extreme high temperatures in summer in short term but more in long term (medium) • Higher nighttime temperatures both summer and winter (high) • More freeze-thaw cycles (high) • Increased temperature variability (high) Follows trend of last 25 years and projected by models No current trend but model suggestion or current trend but models inconclusive *Estimated from IPCC reports
Projected Changes* for the Climate of the Midwest Precipitation • More (~10%) precipitation annually (medium) • Change in “seasonality”: Most of the increase will come in the first half of the year (wetter springs, drier summers) (high) • More water-logging of soils (medium) • More variability of summer precipitation (high) • More intense rain events and hence more runoff (high) • Higher episodic streamflow (medium) • Longer periods without rain (medium) • Higher absolute humidity (high) • Stronger storm systems (medium) • Snowfall increases (late winter) in short term but decreases in long run (medium) • More winter soil moisture recharge Follows trend of last 25 years and projected by models No current trend but model suggestion or current trend but models inconclusive *Estimated from IPCC reports
Projected Changes* for the Climate of the Midwest Other • Reduced wind speeds (high) • Reduced solar radiation (medium) • Increased tropospheric ozone (high) • Accelerated loss of soil carbon (high) • Phenological states are shortened high) • Weeds grow more rapidly under elevated atmospheric CO2 (high) • Weeds migrate northward and are less sensitive to herbicides (high) • Plants have increased water used efficiency (high) Follows trend of last 25 years and projected by models No current trend but model suggestion or current trend but models inconclusive *Estimated from IPCC and CCSP reports
For More Information • For peer-reviewed evidence supporting everything you have seen in this presentation, see my online Global Change course: http://www.meteor.iastate.edu/gccourse • Contact me directly: gstakle@iastate.edu • Current research on regional climate and climate change is being conducted at Iowa State Unversity under the Regional Climate Modeling Laboratory http://rcmlab.agron.iastate.edu/ • North American Regional Climate Change Assessment Program http://www.narccap.ucar.edu/ • For this and other climate change presentations see my personal website: http://www.meteor.iastate.edu/faculty/takle/ Or just Google Eugene Takle