Download
1 / 59
600 likes | 846 Views
Planning a Healthy Diet ChooseMyPlate Dietary Guidelines, 2010 Food Labels. Chapter 2. Review From Last Week. Dr. Weil’s Anti-Inflammatory Pyramid. Objectives. After reading Chapter 2, class discussion, and learning activities, you will be able to: Describe ChooseMyPlate

E N D
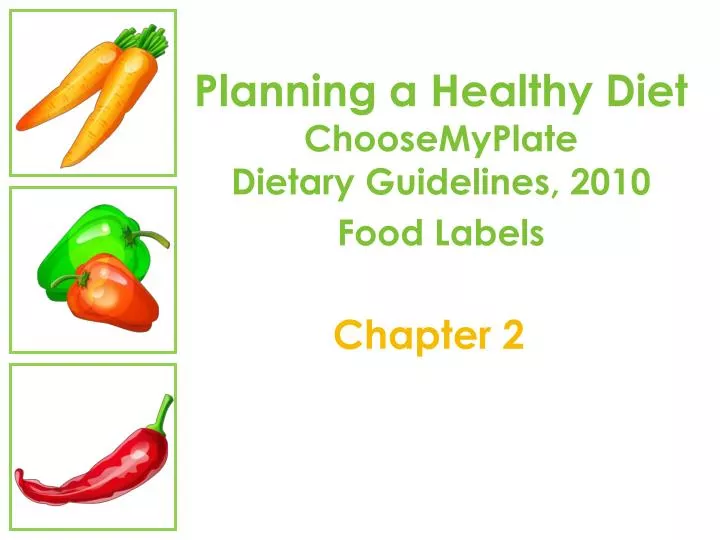
Planning a Healthy Diet ChooseMyPlateDietary Guidelines, 2010 Food Labels Chapter 2
Objectives After reading Chapter 2, class discussion, and learning activities, you will be able to: Describe ChooseMyPlate Describe the relationship between food group recommendations and calorie levels List ChooseMyPlate guidelines, food placement and recommendations for each food group Utilize ChooseMyPlate for personal food evalution and recipe modification Describe the concept of portion distortion
Objectives • Identify ways to estimate and reduce portion size • Discuss the 2005/2010 Dietary Guidelines for Americans • Discuss basic implementation of each guideline • Identify components of the food label • Interpret information from the food label • Define various label definitions • Distinguish nutrient claims vs health claims on the food label • Read ingredient lists
Concepts…… • Dietary Recommendations • Food groups, specific foods and nutrients • Dietary Reference Intakes • Technical, specific nutrient recommendations • Food Guides • Kinds and amounts of foods to make a nutritionally adequate diet • Choose My Plate
Choose MyPlate says: Balance calories Foods to increase Foods to reduce
Choose MyPlate says: 1. Balance calories Enjoy your food, but eat less Avoid oversized portions
Choose MyPlate says: Foods to increase Make ½ your plate fruits and veggies Make at least ½ your grains whole grains Switch to fat-free or low-fat (1% milk)
Choose MyPlate says: 3. Foods to reduce Compare sodium in prepared foods - choose lower numbers Drink water instead of sugary drinks
MyPlate: Grain Group • 19-50 y.o. • 6-8 oz a day • Make half grain intake “whole” • Whole vs. refined • 1 ounce equivalent = • 1 slice bread • 1 small muffin • 1 cup ready-to-eat cereal flakes • ½ cup cooked rice, pasta, or cooked cereal
MyPlate: Vegetable Group • 19-50 y.o. • 2 ½-3 cups a day • Vary your vegetables • 5 groups • Dark green • Red and orange • Beans and peas • Starchy • Other • 1 cup vegetables = • 1 cup cut-up raw or cooked vegetables • 1 cup vegetable juice • 2 cups leafy salad greens (raw)
MyPlate: Fruit Group • 19-51 y.o. • 1 ½- 2 cups a day • Focus on fruits • 1 cup fruit = • 1 cup cut-up raw or cooked fruit • 1 cup 100% fruit juice
MyPlate: Protein Group • 19-50 y.o. • 5 ½ - 6 ½ oz a day: • Go lean with protein • 1 oz equivalent = • 1 ounce lean meat, poultry, or fish/seafood • 1 egg • ¼ cup cooked dry beans or tofu • 1 T. peanut butter • ½ ounce nuts or seeds
MyPlate: Dairy Group • 19-50 y.o. • 3 cups a day • Foods included: • Fat free, low fat milk • Milk based desserts • Cheese • Fat free, low fat Yogurt • Soy milk • 1 cup = • 1 cup milk or yogurt • 1-1/2 ounces natural cheese (such as cheddar) • 2 ounces processed cheese (such as American) • Get your calcium-rich foods
My Plate Based On Calorie Needs pages 42-43
Discretionary Kcals • “Empty calorie limit” • Solid Fats, Added Sugars • Allows for: • Increased amount of food • Foods not in the lowest fat form • Foods that contain added sugars • Alcohol
Examples of Discretionary Kcals • Fat in cheese, whole milk, cream • Fat in poultry skin, sausage, higher fat meats • Sugar added to beverages, sauces • Pies, cookies, etc. because of sugar and/or fats
Portion Size Comparisons Choose MyPlate portions do not always match food label serving sizes US portion sizes steadily increasing Large portions= more calories, fat, sodium, etc. Food labels/nutrition information allows consumers to compare
Portion Distortion • “To change the shape, size” • “Not true representing true facts or reality” • Difficult to accurately estimate diet intake • Consumer error on low-side of intake • Effects all people 3+ in age
Portion Distortion Trends • Restaurants servings 250% larger than 20 years ago • Dinner plate surface area 40% larger than 1960 • Joy of Cooking entrée portions 42% larger • Super, biggie, king-size, jumbo • http://www.youtube.com/watch?v=A6QnCdc6LkY
Top 3 Portion Infuences • Large serving sizes (restaurants-stores) • Purchasing large amounts of food • Large size dishware (plates, cups, bowls)
Large Portions Add Up 100 extra calories per day 10 pound weight gain per year Maintaining a Healthy Weight Calories In = Calories Out
French Fries 2.4 ounces 210 calories 13 grams fat 177 mg sodium 7 ounces 610 calories 20 grams fat 380 mg sodium Calorie difference: 400 calories
Walking leisurely for 1 hour and 10 minutesburns approximately 400 calories* Increased French fries size: 400 more calories *Based on 160-pound person
What Food Professionals Can Do… • Offering smaller options on menu’s • Provide nutrition information for customer comparison
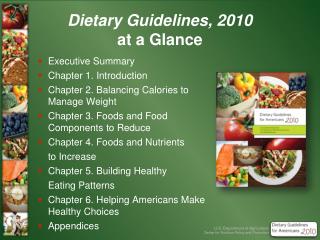
2010 Dietary Guidelines for Americans Science-based advice to promote health and reduce risk for chronic diseases thru diet and physical activity Healthy, 2 years and older By law, updated every 5 years HHS & USDA Public health 2005 in text, 2010 in powerpoints
2010 Dietary GuidelinesWeight Control #1. Maintain kcalorie balance over time to achieve and sustain a healthy weight Calories Physical Activity Body Mass Index (BMI) Page 36
Physical Activity • 6-17 y.o. children and adolescents • 60 minutes or more of physical activity a day • 18-61 y.o. adults • 2 hours and 30 minutes a week, moderate (up to 5) or • 1 hour and 15 minutes a week, vigorous (up to 2 ½) • Muscle strengthening activities 2+ days a week • 65 and older adults • As ability and condition allow, improve balance
2. Food Groups to Encourage/Increase Increase vegetables and fruits Increase milk, milk products to 3 cups day Increase lean proteins Increase whole grains, 3 oz. a day or ½ of grain intake p. 34; 36-37
Whole Grains Examples Whole wheat Whole oats/oatmeal Whole corn Popcorn Brown rice Whole rye Bulgur Millet Quinoa Barley
3. Nutrients To Reduce Sodium Healthy, under 51 y.o. 2300 mg a day or less about 1 teaspoon of salt Over 51 y.o., all African Americans, those with chronic diseases Canned, processed 1500 mg a day or less
3. Nutrients to Reduce Reduce saturated fat and trans fats Less than 10% of total calories Reduce added sugar Focus on sugary beverages Reduce alcohol Reduce refined grains
Fats Consume less than 10% of kcalories from saturated fatty acids Less than 300 mg/day of cholesterol Keep trans fatty acids as low as possible Keep total fat intake between 20 to 35% of kcalories Most fats from polyunsaturated and monounsaturated sources, such as fish, nuts, and vegetable oils.
Fats When selecting and preparing meat, poultry, dry beans, and milk or milk products, make choices that are lean, low-fat, or fat-free. Limit intake of fats and oils high in saturated and/or trans fatty acids
Alcoholic Beverages Moderation ___ drinks/day for men ___ drink/day for women 1 drink = ____ beer ____ wine ____ distilled spirits p. 35; 38
Food Safety To avoid microbial food borne illness: Clean hands, food contact surfaces, and fruit and vegetables. Meat and poultry should not be washed or rinsed. Separate raw, cooked, and ready-to-eat foods while shopping, preparing, or storing foods. Cook foods to a safe temperature to kill microorganisms. Chill (refrigerate) perishable food promptly and defrost foods properly. Avoid raw (unpasteurized) milk or any products made from raw milk, raw or partially cooked eggs or foods containing raw eggs.
Food Labels • 64% consumers check Nutrition Facts panel when buying foods (2010) • 48% use it to make healthful choices • 23% use it when trying to lose weight • From 2004/2010 Shopping for Health Survey
Food Labels & College Students 537 randomly selected college students Mean age =23 + 6 177 men; 360 women 80% normal wt; 80% non-smokers 67% met activity recommendations 44% used nutritional supplements J.Am.Diet Assoc 2007 107:2130-2134
Results: Food Labels & College Students 55% never taught how to use labels 66% used label when buying food Most often used info: Total fat; calories; serving size Least often used info: Fiber; iron; Vitamin A Women used more frequently
Results: Food Labels & College Students 92% correctly identified Daily Value for grams of fat 67% correctly identified foods with highest grams of fat and fiber 11% correctly defined “serving size” 33% believed labels not accurate 67% believed nutrition claims untrue 50% believed health claims untrue
Nutrition Facts Panel Daily Value: A set of nutrient-intake values developed by the Food and Drug Administration used as a reference for expressing nutrient content on nutrition labels. Based on a 2000 kcal/day intake
Food Label Claims Nutrient claims: statements that characterize the quantity of a nutrient in a food (p.64; 65) Health claims: statements that characterize the relationship between a nutrient in a food and a disease or health related condition (p.64; 66) Structure-function claims: statements characterizing relationship of nutrient with role in the body p. 64 - 67
Food Label Claims Nutrient claims: Example: “rich in calcium” Health claims: Example: “Sodium and reduced risk of hypertension” FDA approved statement Structure-function claims: Example: “build strong bones” Legal but not FDA approved Page 65-66