Download
1 / 12
120 likes | 240 Views
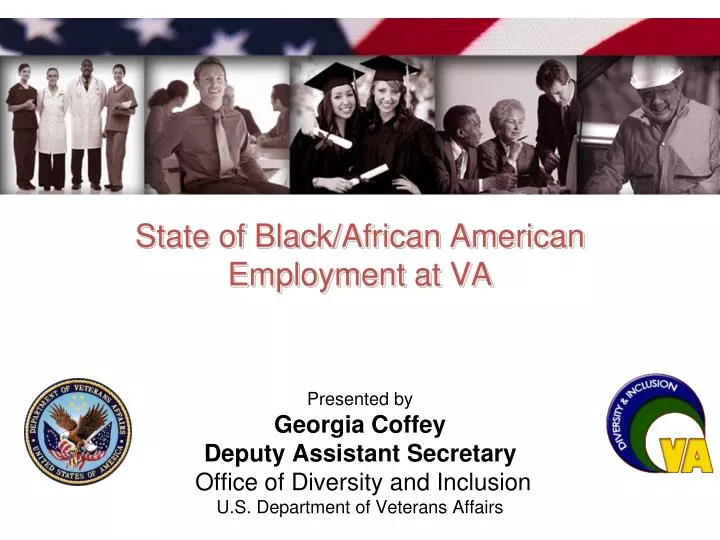
State of Black/African American Employment at VA. Presented by Georgia Coffey Deputy Assistant Secretary Office of Diversity and Inclusion U.S. Department of Veterans Affairs. Mission & Vision. Mission. Vision.

E N D
State of Black/African American Employment at VA Presented by Georgia Coffey Deputy Assistant Secretary Office of Diversity and Inclusion U.S. Department of Veterans Affairs
Mission & Vision Mission Vision That VA is a leader in creating and sustaining a high-performing workforce by leveraging diversity and empowering employees to achieve superior results in service to our Nation and its Veterans. • To build a diverse workforce and cultivate an inclusive workplace to deliver the best services to our Nation’s Veterans, their families, and beneficiaries.
Black Employment Representation Compared to Civilian Labor Force (CLF) and Relevant Civilian Labor Force (RCLF) Both men and women show greater than expected participation rates. Employee Count FY2009 69,461 FY2010 71,500 FY2011 73,429 1 Civilian Labor Force (CLF) is defined as people in American 16 years of age and over, except those in the armed forces, who are employed or are unemployed or are unemployed and seeking work. It’s derived from census data collected on the demographics of citizens in each job type. 2 Relevant Civilian Labor Force (RCLF) reflects all the people in America 16 years of age or over, employed in or actively seeking work in VA specific occupations (used as a comparative baseline for demographic analysis). * Permanent and Temporary * CLF as of 2000
Onboard by Pay Plan * Permanent and Temporary
GS/GM 13-15 Onboard * Permanent and Temporary
SES and Title-38 Onboard * Permanent and Temporary
Promotion * Permanent and Temporary
Top 5 Occupations for Black Employment VA-Wide • Nurse – 9,124 • Custodial Worker – 5,395 • Medical Support Assistance – 5,386 • Nursing Assistant – 5,224 • Miscellaneous Clerk and Assistant – 4,241 * Permanent and Temporary * As of June 2012
Wage Grade • There is a disproportionate number of Black/African American males in wage grade occupations • 8.96% of VA’s total permanent employees are wage grade. Of this group, 41.13% of them are Black/African Americans. * As of June 2012
Takeaways • Black/African Americans are well represented in VA. • High concentration Black/African American men in wage grade occupations. • Representation diminishes as grade increases—particularly for GS/GM 13-15. • Representation of Black/African American women slightly better than representation of Black/African American men for GS/GM 13-15 • Black men are promoted at a higher rate than onboard; Black women are promoted at 96 percent of onboard.
Moving Ahead • Perform additional analysis to identify triggers to full participation of Black/African Americans. • Examine applicant flow data for all VA positions as well as SES Pilot to determine VA’s outreach efforts to Black/African Americans. • Implement a TMS pilot project with wage grade employees to see impact on upward mobility/career development.
Contact Us Trina Faison VA’s National Program Manager for African American Employment Program Phone: (202) 461-4044 E-mail: trina.faison@va.gov Web: http://www.diversity.va.gov/