Download
1 / 1
10 likes | 119 Views
Differences in Bullying Victimization Between Students With and Without Disabilities George Bear, Lindsey Mantz, Deborah Boyer, & Linda Smith. Additional Findings. Abstract. Method.

E N D
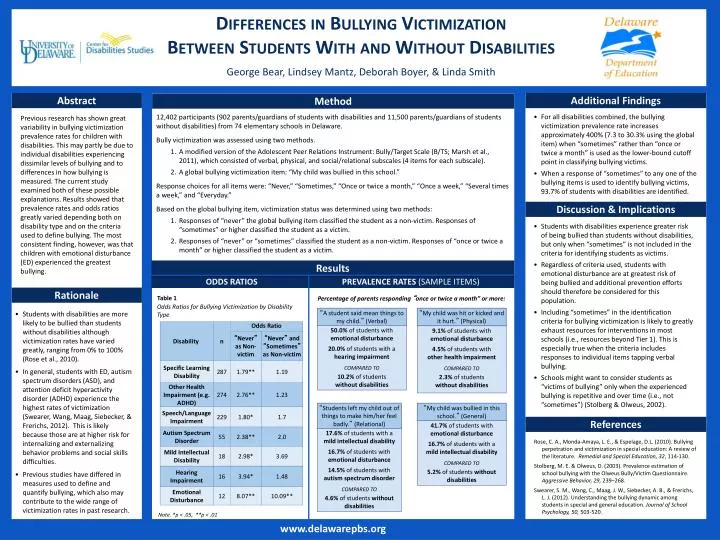
Differences in Bullying Victimization Between Students With and Without Disabilities George Bear, Lindsey Mantz, Deborah Boyer, & Linda Smith Additional Findings Abstract Method • For all disabilities combined, the bullying victimization prevalence rate increases approximately 400% (7.3 to 30.3% using the global item) when “sometimes” rather than “once or twice a month” is used as the lower-bound cutoff point in classifying bullying victims. • When a response of “sometimes” to any one of the bullying items is used to identify bullying victims, 93.7% of students with disabilities are identified. • 12,402 participants (902 parents/guardians of students with disabilities and 11,500 parents/guardians of students without disabilities) from 74 elementary schools in Delaware. • Bully victimization was assessed using two methods. • A modified version of the Adolescent Peer Relations Instrument: Bully/Target Scale (B/TS; Marsh et al., 2011), which consisted of verbal, physical, and social/relational subscales (4 items for each subscale). • A global bullying victimization item: “My child was bullied in this school.” • Response choices for all items were: “Never,” “Sometimes,” “Once or twice a month,” “Once a week,” “Several times a week,” and “Everyday.” • Based on the global bullying item, victimization status was determined using two methods: • Responses of “never” the global bullying item classified the student as a non-victim. Responses of “sometimes” or higher classified the student as a victim. • Responses of “never” or “sometimes” classified the student as a non-victim. Responses of “once or twice a month” or higher classified the student as a victim. Previous research has shown great variability in bullying victimization prevalence rates for children with disabilities. This may partly be due to individual disabilities experiencing dissimilar levels of bullying and to differences in how bullying is measured. The current study examined both of these possible explanations. Results showed that prevalence rates and odds ratios greatly varied depending both on disability type and on the criteria used to define bullying. The most consistent finding, however, was that children with emotional disturbance (ED) experienced the greatest bullying. Discussion & Implications • Students with disabilities experience greater risk of being bullied than students without disabilities, but only when “sometimes” is not included in the criteria for identifying students as victims. • Regardless of criteria used, students with emotional disturbance are at greatest risk of being bullied and additional prevention efforts should therefore be considered for this population. • Including “sometimes” in the identification criteria for bullying victimization is likely to greatly exhaust resources for interventions in most schools(i.e., resources beyond Tier 1). This is especially true when the criteria includes responses to individual items tapping verbal bullying. • Schools might want to consider students as “victims of bullying” only when the experienced bullying is repetitive and over time (i.e., not “sometimes”) (Stolberg & Olweus, 2002). Results ODDS RATIOS PREVALENCE RATES (SAMPLE ITEMS) Rationale Table 1 • Percentage of parents responding “once or twice a month” or more: Odds Ratios for Bullying Victimization by Disability Type “A student said mean things to my child.” (Verbal) “My child was hit or kicked and it hurt.” (Physical) • Students with disabilities are more likely to be bullied than students without disabilities although victimization rates have varied greatly, ranging from 0% to 100% (Rose et al., 2010). • In general, students with ED, autism spectrum disorders (ASD), and attention deficit hyperactivity disorder (ADHD) experience the highest rates of victimization (Swearer, Wang, Maag, Siebecker, & Frerichs, 2012). This is likely because those are at higher risk for internalizing and externalizing behavior problems and social skills difficulties. • Previous studies have differed in measures used to define and quantify bullying, which also may contribute to the wide range of victimization rates in past research. • 50.0% of students with emotional disturbance • 20.0% of students with a hearing impairment • COMPARED TO • 10.2% of students without disabilities • 9.1% of students with emotional disturbance • 4.5% of students with other health impairment • COMPARED TO • 2.3% of students without disabilities “My child was bullied in this school.” (General) “Students left my child out of things to make him/her feel badly.” (Relational) References • 41.7% of students with emotional disturbance • 16.7% of students with a mild intellectual disability • COMPARED TO • 5.2% of students without disabilities • 17.6% of students with a mild intellectual disability • 16.7% of students with emotional disturbance • 14.5% of students with autism spectrum disorder • COMPARED TO • 4.6% of students without disabilities Rose, C. A., Monda-Amaya, L. E., & Espelage, D.L. (2010). Bullying perpetration and victimization in special education: A review of the literature. Remedial and Special Education, 32, 114-130. Stolberg, M. E. & Olweus, D. (2003). Prevalence estimation of school bullying with the Olweus Bully/Victim Questionnaire. Aggressive Behavior, 29, 239–268. Swearer, S. M., Wang, C., Maag, J. W., Siebecker, A. B., & Frerichs, L. J. (2012). Understanding the bullying dynamic among students in special and general education. Journal of School Psychology, 50, 503-520. Note. *p < .05, **p < .01 www.delawarepbs.org