Download
1 / 1
10 likes | 109 Views
Nonlinear associations between Northern Hemisphere winter climate and ENSO/AO. Aiming Wu 1 , William W. Hsieh 1 , and Amir Shabbar 2 (whsieh@eos.ubc.ca) 1. Dept. of Earth and Ocean Sciences, University of British Columbia, Vancouver, BC, Canada

E N D
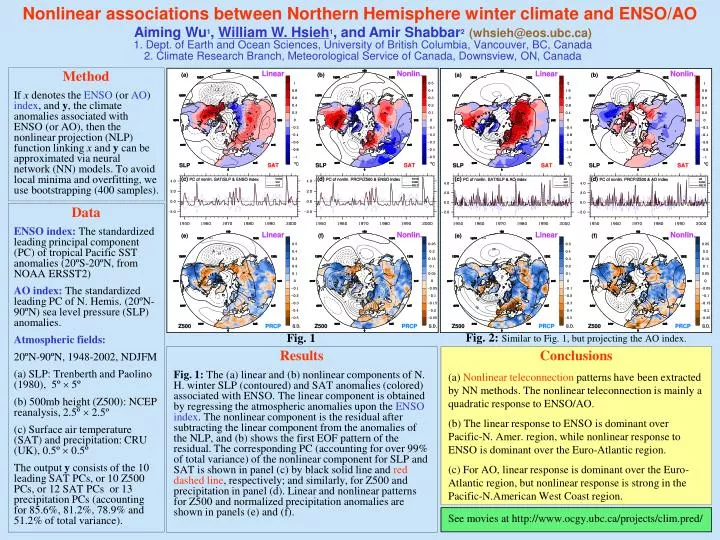
Nonlinear associations between Northern Hemisphere winter climate and ENSO/AO Aiming Wu1, William W. Hsieh1, and Amir Shabbar2 (whsieh@eos.ubc.ca) 1. Dept. of Earth and Ocean Sciences, University of British Columbia, Vancouver, BC, Canada 2. Climate Research Branch, Meteorological Service of Canada, Downsview, ON, Canada Method If x denotes the ENSO (or AO) index, and y, the climate anomalies associated with ENSO (or AO), then the nonlinear projection (NLP) function linking x and y can be approximated via neural network (NN) models. To avoid local minima and overfitting, we use bootstrapping (400 samples). Data ENSO index:The standardized leading principal component (PC) of tropical Pacific SST anomalies (20ºS-20ºN, from NOAA ERSST2) AO index:The standardized leading PC of N. Hemis. (20ºN-90ºN) sea level pressure (SLP) anomalies. Atmospheric fields: 20ºN-90ºN, 1948-2002, NDJFM (a) SLP: Trenberth and Paolino (1980), 5º 5º (b) 500mb height (Z500): NCEP reanalysis, 2.5º 2.5º (c) Surface air temperature (SAT) and precipitation: CRU (UK), 0.5º 0.5º The output y consists of the 10 leading SAT PCs, or 10 Z500 PCs, or 12 SAT PCs or 13 precipitation PCs (accounting for 85.6%, 81.2%, 78.9% and 51.2% of total variance). Fig. 1 Fig. 2:Similar to Fig. 1, but projecting the AO index. Results Fig. 1: The (a) linear and (b) nonlinear components of N. H. winter SLP (contoured) and SAT anomalies (colored) associated with ENSO. The linear component is obtained by regressing the atmospheric anomalies upon the ENSO index. The nonlinear component is the residual after subtracting the linear component from the anomalies of the NLP, and (b) shows the first EOF pattern of the residual. The corresponding PC (accounting for over 99% of total variance) of the nonlinear component for SLP and SAT is shown in panel (c) by black solid line and red dashed line, respectively; and similarly, for Z500 and precipitation in panel (d). Linear and nonlinear patterns for Z500 and normalized precipitation anomalies are shown in panels (e) and (f). Conclusions (a) Nonlinear teleconnection patterns have been extracted by NN methods. The nonlinear teleconnection is mainly a quadratic response to ENSO/AO. (b) The linear response to ENSO is dominant over Pacific-N. Amer. region, while nonlinear response to ENSO is dominant over the Euro-Atlantic region. (c) For AO, linear response is dominant over the Euro-Atlantic region, but nonlinear response is strong in the Pacific-N.American West Coast region. See movies at http://www.ocgy.ubc.ca/projects/clim.pred/