Download
1 / 15
160 likes | 312 Views
Disrupting the Optimal Forager. Domestic Burglary Predictive Mapping. Inspector Jones (Hub Manager) , Matthew Fielding (Intelligence Analyst) National Community Safety Conference 2011 - 8 th June 2011. Disrupting the Optimal Forager Content. Setting the scene

E N D
Disrupting the Optimal Forager Domestic Burglary Predictive Mapping Inspector Jones (Hub Manager) , Matthew Fielding (Intelligence Analyst) National Community Safety Conference 2011 - 8th June 2011
Disrupting the Optimal Forager Content • Setting the scene • Original Concept and Operational Alterations • Implementation • Development from Original Output • Results • Future Developments • Problems Encountered and Conclusions
Contextual Map Greater Manchester Population: 2.6 million Area: 496 m2 Ethnicity: 88.9% White, 6.5% S. Asian, 1.7% Black, 2.9% Other Trafford Population: 212,800 Area: 41 m2 Ethnicity: 89.7% White, 5.1% S. Asian, 2.3% Black, 2.9% Other
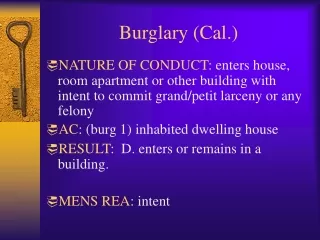
Original Concept Ross and Pease (2007) discussed the possibility of predicting Burglaries based on the ‘Optimal Forager’ theory of offender patterns in an article entitled, ‘Predicting Where Lightening will Strike’ The premise of this was: “In domestic burglary, for example, the danger of a further crime is greatest at the home of the original victim and spreads out to some 400 metres, but disappears over six weeks to two months … instead of mapping past events in the conventional way we should map the risk they generate for nearby homes, with the map being dynamic to reflect how the risk declines over time.” Professor Ken Pease B.A., M.A., PhD. OBE Nick Ross
Operationalizing the Scientific Theory There were three main modifications made to the original study to implement the work into Trafford BCU more effectively • The time period of analysis of Burglaries was reduced from six weeks to three weeks. • Implementation of the coloured buffers to highlight diminishing risk over time • Introduction of a temporal aspect to the individual Burglary Predictive Risk areas
Original Theory vs Output Every day 00:00-04:00, Particularly 02:00-03:00 Also 16:00-19:00 Friday and Monday Ross and Pease (2007): “In domestic burglary, for example, the danger of a further crime is greatest at the home of the original victim and spreads out to some 400 metres, but disappears over six weeks to two months … instead of mapping past events in the conventional way we should map the risk they generate for nearby homes, with the map being dynamic to reflect how the risk declines over time.”
Implementation Initial idea and development Disseminated to NPT’s Fixed Wing I99 TFU RPU Response Feedback and improvement Evaluation Community Safety Patrollers GMFRS Driving School Feedback and improvement Evaluation
Predictive Mapping Output • Risk around Stretford Metrolink is late morning. • Risk from Neighbouring Division every evening 20:00-22:00
Results – 12 month review • Trafford saw 902 burglaries, 2nd lowest count across GMP • YTD 2009, Trafford saw a significant 26.6% decrease (1229 to 902 BDW) (GMP –9.8%, MSG BCU GMP saw an increase of 7%)
Results BDW Count Orange Red Yellow Blue Outside Total 2009/10 139 234 218 159 479 1229 2010/11 66 128 141 97 470 902 Change -52.5% -45.3% -35.6% -38.8% -1.9% -26.6% • Statistically Significant Reduction • £1.06m saved to potential victims (Home Office ave. cost of £3268 per BDW) • ‘Dark Nights’ (Period of Clock Change) 25/10/09 - 28/03/10 vs 31/10/10 -27/03/11 Trafford: 30% decrease 527 to 368 BDW GMP: 14% decrease 7884 to 7560 BDW MSG BCU GMP: 8% increase 663 to 716 BDW • Average of 48% decrease in the target areas of Orange and Red (373 to 194 BDW) • Outside Predicted zone 38% due to insecurity
On-Going Developments • Investigate the displacement of offences, which were seen in Trafford, to non-predicted areas. Crime Prediction Intervention Intervention Prediction • Increased Guardianship of key areas using Partner and wider GMP resources • Improved intelligence via the endorsement of Stop and Search Forms/FIS Submissions • Utilising ARLS effectively • Shift Activity Submissions
Conclusion • Importance of Reading and Understanding the simplicity of the concept • Potential to understand weekly spikes • Focuses on Optimal Forager (highest volume offender) • Scientific approach to assist targeted use of resources (Internal and External) • Improved intelligence gathering and taskings • Non - Engagement • Utilizes current GMP mapping system • Minimal cost in current financial climate • Wallpaper
Questions and FAQ’s traffordpredictivemapping@gmp.police.uk Inspector Vincent Jones 0161 856 7549 vincent.jones@gmp.police.uk Matthew Fielding 0161 856 7593 matthew.fielding@gmp.police.uk