Download
1 / 51
510 likes | 631 Views
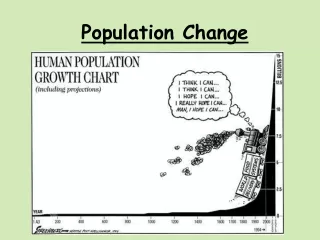
POPULATION CHANGE. CHAPTER -8 RAVEN AND BERG. Read page number 172: Effect of AIDS on population. Population Density. It is the number of individuals of a species per unit area or volume at a given time.

E N D
POPULATION CHANGE CHAPTER -8 RAVEN AND BERG
Population Density • It is the number of individuals of a species per unit area or volume at a given time. • For a given species, different environments support varying population densities. Density also varies in a single habitat from season to season or year to year.
Death rate Growth rate Emigration rate Birth rate Immigration rate Calculating Population Change r = (b – d) + (i – e)
Population Change • If organisms in the population are born faster than they die, r is a positive value, and population size increases. • If organisms in the population die faster than they are born, r is a negative value, and population size decreases. • If r is equal to zero, births and deaths match, and population size is stationary despite continued reproduction and death. • Dispersal, or movement from one region or country to another is considered when changes in population on a local scale are examined. • There are two types of dispersal: immigration (i), in which individuals enter a population and increase in size, and emigration (e), in which individuals leave a population and decrease in size.
Factors affecting growth rate • Birth rate (b) • Death rate (d) • Immigration (i) • Emigration (e) • The growth rate equals ( the birth rate minus the death rate) plus (immigration minus emigration) • Look at the sample problem in your text book 174
Maximum Population Growth • The maximum rate that a population could increase under ideal conditions is its intrinsic rate of increase. (also called biotic potential) • It is also the exponential growth of a population that occurs under ideal conditions. • Larger organisms, such as blue whales and elephants, have the smallest intrinsic rates of increase, whereas microorganisms have the greatest intrinsic rates of increase.
Exponential Population Growth • If you plot the population number versus time, the graph has a j shape characteristic of exponential population growth. When a population grows exponentially, the larger the population gets, the faster it gets.
Environmental Resistance and Carrying Capacity • Organisms cannot reproduce indefinitely at their intrinsic rates of increase because the environment sets limits, collectively called environmental resistance. Environmental resistance includes such unfavorable environmental conditions as the limited availability of food, water, shelter, competition, as well as limits imposed by disease and predation.
Carrying capacity (k) • The maximum number of individuals of a given species that a particular environment can support for an indefinite period, assuming there are no changes in the environment. • In nature, the carrying capacity is dynamic and changes in response to environmental changes. An extended drought, for example could decrease the amount of vegetation growing in an area, and this change, in turn, would lower the carrying capacity for deer and other herbivores in the environment.
Experiment conducted by G.F Gause • Russian ecologist conducted experiments during the 1930s. • Paramecium caudatum-when supplied with a limited amount of food (bacteria) increased exponentially at first, then growth rate declined to zero and the population size leveled off. • When a population affected by environmental resistance is graphed over a long period, the curve has a characteristic S-shape of logistic population growth. • A population rarely stabilizes at K, but may temporarily rise higher than K. it will drop back to, or below the carrying capacity. • Sometimes a population that overshoots K will experience a population crash, and it is seen in populations whose resources are exhausted.
Population Crash • The availability of winter forage largely determines the carrying capacity for reindeer. • In 1910, a small herd of 26 reindeer was introduced on one of the Pribilof Islands of Alaska. • The herd’s population increased exponentially for about 25 years until there were approximately 2000 reindeer, many more than the island could support, particularly in winter. • The reindeer overgrazed the vegetation until the plant life was wiped out. • The reindeer died from starvation, the number plunged to 8, about one third of the original introduced population. • Recovery of arctic and subarctic vegetation after overgrazing y reindeer takes 15 to 20 years, and during that time the carrying capacity is greatly reduced.
Example: Exponential growth of bacteria • Bacteria would never reproduce unchecked for an indefinite period because they would run out of food and living space, and poisonous body wastes would accumulate in their vicinity. With crowding, bacteria would become more susceptible to parasites and predators. • As the environment deteriorates, their birth rate would decline and their death rate would increase. The environmental conditions might worsen to a point where death rate would exceed birth rate, and the population would decrease.
Negative Feedback Mechanism • Population increase • Increase in environmental Resistance Limit population growth Environmental resistance is an excellent example of a negative feedback mechanism
Factors That Affect Population Size Density Dependent Factors Predation have a greater influence on a population when its density is greater. As population density increases, density-dependent factors tend to slow population growth by causing an increase in death rate and/ or a decrease in birth rate. Predation, disease, and competition are examples of density-dependent factors. http://www.surrey-arg.org.uk/SARG/08000-TheAnimals/SARGSpeciesData.asp?Species=Common_Frog
Lemming Population Oscillations • Lemmings are small rodents that live in colder parts of the Northern Hemisphere. • Lemming populations undergo dramatic increases in their population, followed by crashes over fairly regular time intervals-every three to four years. • This cyclic fluctuation in abundance is often described as boom- or -bust cycle. • The actual causes of such population oscillations are poorly understood, but many hypothesis involve density-dependent factors.
-- • The population density of lemming predators, such as weasels, arctic foxes, may increase in response to the increasing density of prey. As more predators consume the abundant prey, the prey population declines. • A huge prey population overwhelms the food supply • Parasites also control the lemming populations
Case Study- Predator Prey Dynamics on Isle Royale Read case in Point page number 178-179
Factors That Affect Population Size Density Independent Factors http://www.blm.gov/ut/st/en/fo/monticello/fire.html http://piperbasenji.blogspot.com/2010/12/jack-frost.html http://www.town.scituate.ma.us/flood/index.html
Density Independent Factors • An environmental factor that affects the size of a population but is not influenced by changes in population density. • Density independent factors are typically abiotic. • A killing frost severe blizzard, hurricane, or fire may cause reduction in a population regardless of its size and are largely density independent.
Reproductive Strategies r-selected species Growth rate is high http://www.wildish.eu/tag/dandelion/ http://www.ong-efa.org/?p=252&lang=en
R strategies • Small body size • Easrly maturity • Short life span • Large broods • Little or no parental care • Found in variable, temporary, or unpedictable environments • Long-term survival is low • Best examples are mosquitoes and common weeds such as the dandelions
K-selected species (N is near K)
K-stsrategies • Long life spans with slow development • Do not produce large number of offspring • Late reproduction • Large body size, and low reproductive rate • Invest in the parental care of their young • Found in constant or stable environments, where they have a high competitive ability • Read about Tawny owls (k strategists) page 181
Survivorship • The probability a given individual in a population will survive to a particular age. • Survivorship is the proportion of newborn individuals that are alive at a given age. • In type I survivorship, as exemplified by humans and elephants, the young and those at reproductive age have a high probability of living. The probability of survival decreases more rapidly with increasing age, and deaths are concentrated later in life.
Survivorship • In type III survivorship, the probability of death is greatest early in life, and those individuals that avoid early death subsequently have a high probability of survival • This is characteristic of many fish species and oysters. • In type II survivorship, the probability of survivorship does not change with age. The probability of death is across all age groups resulting in linear decline in survivorship. Some lizards show this type. • Herring gulls have a type III survivorship early in life and a type II curve as adults.
Human Population • Demography • Science of population structure and growth http://www.youtube.com/watch?v=sc4HxPxNrZ0&feature=related 7 Billion Population Growth -2011 video
Thomas Malthus (British Economist) • According to him • Human population cannot increase indefinitely. • Human population growth is not always desirable and that human population can increase faster than its food supply. • The inevitable consequences of population growth, are famine, disease, and war. • Our population has grown so dramatically because scientific advances have allowed food production to keep pace with population growth
Current Population Numbers • 7 billion • This increase is not due to an increase in the birth rate. In fact the world birth rate has declined during the past 200 years. Increase in population is due to a dramatic decrease in the death rate which has occurred primarily because greater food production, better medical care, improvements in water quality, and sanitation practices have increased the life expectancies of great majority of the global population.
Birth and death rates in Mexico, 1900-2000 • Both birth and death rates generally declined in Mexico during the 20th century. The death rate declined much more than the birth rate, so Mexico experienced a high growth rate. • Refer to Mexico’s growth rate in page number 184 (calculation)
Projecting Future Populations Population experts at the United Nations and the World Bank have projected that the growth rate will continue to decrease until zero population growth is attained. At that time, exponential growth of the human population will end, the J curve may be replaced by the S curve. It is projected that zero population growth – will occur toward the end of the 21 st century. The United Nation’s projections for the 21st century 7.7 Billion (low Projection) 9 Billion ( Medium Projection) 10.6 Billion (high Projection) What will happen when the population exceeds the earth’s carrying capacity? According to Statistical analysis done by Jeroen Van Den Bergh Earth’s carrying capacity is 7 Billion.
Demographics of CountriesThe application of population statistics is called demographics
Doubling time • Doubling time (td), the amount of time it would for its population to double in size, assuming its current growth rate does not change. • A simplified formula for doubling time is td=70/r, sometimes called the rule of 70 • The shorter the doubling time, the less developed the country
Replacement-level fertility • Total fertility rate refers to the average number of children born to each woman. • Replacement-level fertility is the number of children a couple must produce to “replace” themselves. It si usually given as 2.1 • Worldwide, the total fertility rate is currently 2.7, well above replacement level.
Demographic StagesBased on the 1945 work of Princeton demographer Frank Notestein • Pre-industrial Stage • Birth and death rates high (plague, famine, and war) • Modest population growth • Transitional Stage • Lowered death rate (improved health care, more reliable food, and water supplies) • Rapid population growth • Industrial Stage • Birth rate decline • Population growth slow • Post Industrial Stage • Low birth and death rates • Population growth very slow
Although the fertility rates in these countries have declined, most still exceed replacement-level fertility. As a result, the population in these countries are still increasing.
Age Structure • The number and proportion of people at each age in a population
Demographics of Specific Countries Read Page number 188 and 189
World-wide • 29% of human population is under age 15 • Could cause large increase in birth rates
Effects of an Aging Population • An aging population has a higher percentage of people who are chronically ill or disabled, and these people require more health care and other social services • Elderly people produce less wealth, they reduce a country’s productive workforce, increases its tax burden, strains its social security, health and pension system. • Sociologist have observe that in aging population the crime rate may decline • Japanese leaders are concerned that there will not be enough young people to support Japan’s growing elderly population. • Russia is offering incentives to young couples who choose to have children (maternity leave, pay for childcare) • Do you think it the right thing to do? • What do you think would be the consequences?